


Chapter 3 Working with MultiLab
65
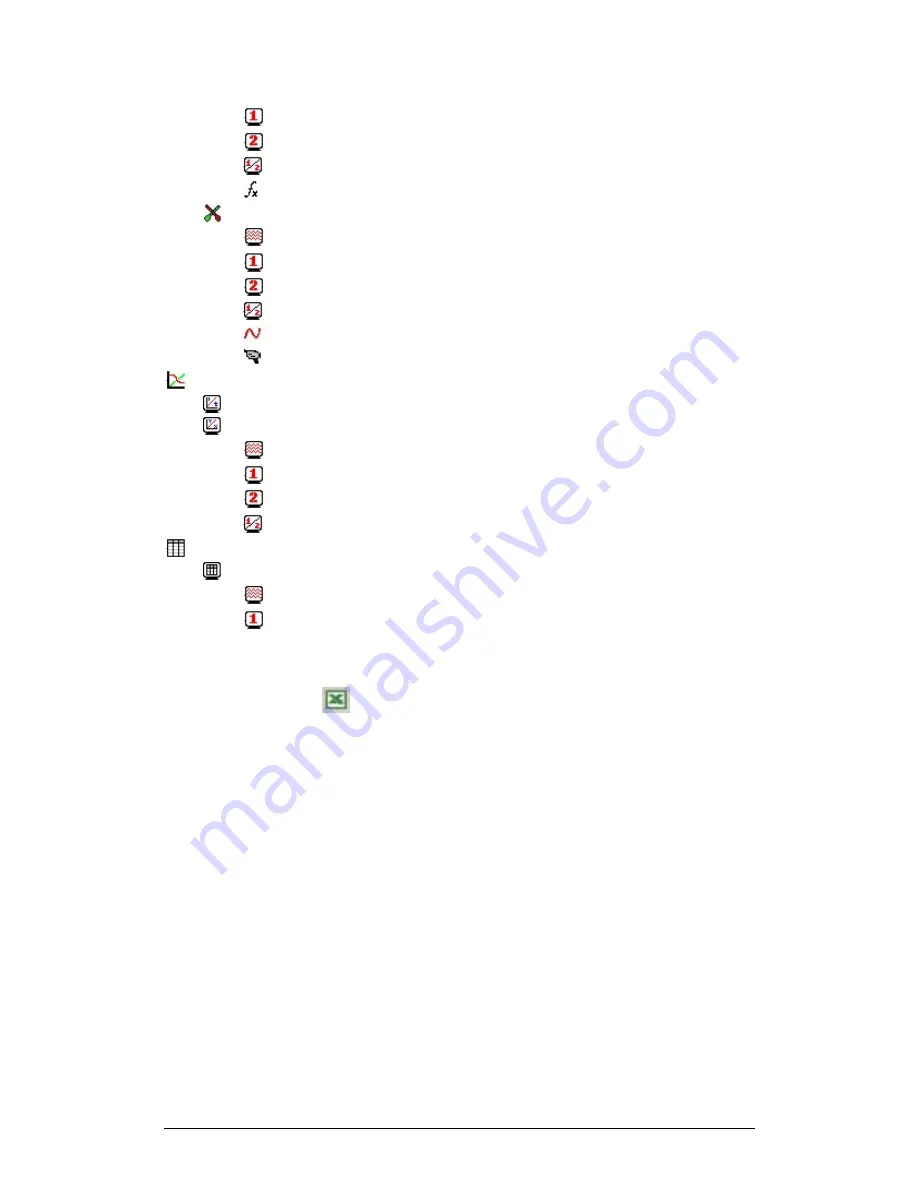
Individual function
–
currently displayed on graph 1
Individual function
–
currently displayed on graph 2
Individual function
–
currently displayed both on graphs 1 and 2
Function
Experiment
–
includes all recorded data of the experiment
Individual data set
–
currently not on display
Individual data set
–
currently displayed on graph 1
Individual data set
–
currently displayed on graph 2
Individual data set
–
currently displayed both on graphs 1 and 2
Data recorded without video
Data recorded with video
List of saved graphs
Saved graph
–
data sets vs. time
Saved graph
–
data sets vs. data set
Graph currently not on display
Graph currently displayed on graph 1
Graph currently displayed on graph 2
Graph currently displayed both on graphs 1 and 2
List of saved tables
Saved table
Table not currently displayed
Table currently displayed
3.4.6.
Export Data to Excel
Click
Export to Excel
on the graph toolbar to export the displayed data to Excel.
MultiLab will then open a new Excel workbook displaying the data.
Export file settings
If MultiLab fails to export the data properly, try to change the export file settings:
1. Click
File
on the menu bar, then click
Export file settings
2. Check the
Ignore regional settings
check box
3. Click
OK
3.4.7.
Copy the Graph as a Picture
You can copy the graph to the clipboard as a picture and then paste it to other
Windows programs such as Word or PowerPoint:
1. In the Graph menu, click
Copy graph
2. Open the destination file
3. In the destination file, right click and select
Paste


