4.14 Clipping Function
4-211
When filtering is performed after clipping, the peak becomes larger than
that when only clipping is performed (see Figure 4.14.8-3), and the crest
factor of the generated waveform pattern may exceed the level set by
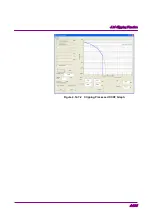
Threshold Level. Figure 4.14.8-3 shows a simulation example of the
CCDF graph where a waveform pattern is generated with Repetition = 1
and the other parameters are set the same as in Section 4.14.7
“Clipping-processed waveform pattern simulation examples.”
For the sake of comparison, Figure 4.14.8-4 shows a CCDF simulation
example where Repetition is changed to 1, 2, and 20. In this example, it
can be seen that the crest factor comes closer to the level set by
Threshold Level as the number of repetition times of clipping and
filtering increases.
Figure 4.14.8-3 Clipping Method Result Comparison (when Repetition = 1)

