


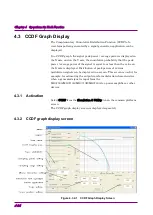


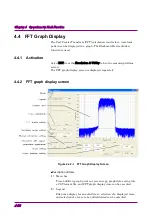

4.3 CCDF Graph Display
4-15
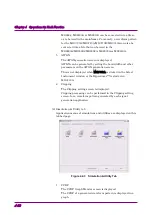
■
Description of items
(1) Menu bar
Trace addition, graph print out, screen copy, graph data saving into
a CSV format file, and CCDF graph display close can be executed.
(2) Legend
File name display for an added trace, selection of a displayed trace,
and selection of a trace to be added/deleted can be executed.
(3) CCDF graph display area
The graphic display area for CCDF Graph cursor move and graph
zoom-in display can be executed.
(4) Crest Factor
The ratio between the peak value and RMS value of the selected
trace is displayed.
(5) Add/Delete (trace addition/deletion)
A trace can be added/deleted.
(6) Sampling Points
The number of samples calculated by reading the selected trace is
displayed. Different sampling points can be set by changing the
value in this text box.
(7) Sampling information display
The sampling range for the selected trace is displayed. A different
sampling range can be set by changing the value in this text box.
(8) Cursor Position
The current graph cursor position is displayed. The graph cursor
position in the CCDF graph display area can be specified by entering
a value in either PAR or Probability text box.
(9) Quick Add Mode (interaction with signal generation application)
Settings for addition of a waveform pattern generated by a signal
generation application to the CCDF graph display in conjunction
with the signal generation application can be configured.
(10) Scale setting
The scale of the X and Y axes in the CCDF graph display area can be
changed.
(11) Mouse Interaction
The mouse operation in the CCDF graph display area can be set to
either the graph cursor move function or the zoom-in function.