


Chapter 4 Operations for Each Function
4-52
When this software is hosted by the MG3700A:
When Normalization is applied, the crest factor (Peak Power / RMS
Power) becomes 14 dB if the signal output of the MG3700A is set within
the level assurance range.
When this software is hosted by the MG3710A/MG3710E/MG3740A;
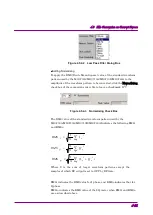
Table 4.5.4-1 The RMS Values of Typical Waveform Pattern per Each
Bit Width
Bit
Width
RMS
I
RMS
Q
RMS
IQ
14 bit
1157
1157
1636
15 bit
2314
2314
3272
16 bit
4628
4628
6545
RMS
I
indicates the RMS value for I phase, and RMS
Q
indicates that for
Q phase.
RMS
IQ
indicates the RMS value of the I/Q vector when RMS
I
and RMS
Q
are as described above.
When Normalization is selected, a crest factor (Peak Power/RMS Power)
of 17 dB can be obtained if the signal output is set within the level
assurance range.
■
Setting RMS and Peak values
When reading a waveform pattern, the data is read from the conversion
source file and the RMS and Peak values are calculated and displayed.
Click the RMS Value box and enter an RMS value of the waveform after
conversion to be actually used. The Peak value changes in conjunction
with the RMS value. On the other hand, when the Peak value is set in
the Peak Value box, the RMS value changes in conjunction with the RMS
value.
Though the setting of Normalizing above is usually sufficient, this
setting (adjustment) is also essential in the following purpose;
To output a large crest factor waveform,
To optimize the distortion, floor noise or carrier leak of modulated output
signal.