4.13 Time Domain Graph Display
4-191
4.13.10 Values displayed on graph
This section describes how a trace on the I, Q, Power, and Marker graphs
displays the data or marker of the waveform pattern, separately for each
graph type.
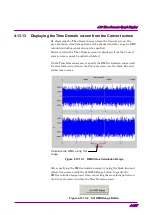
■I and Q graphs
On the I and Q graphs (displayed when “I, Q, Marker” is selected from
the Graph Type drop-down list), the sample values of the read waveform
pattern are plotted and adjacent samples are connected by linear
interpolation. Note that the sample-unit time scale above the I graph
applies only to the trace selected by Legend, while the ms-unit time scale
below the Q graph applies to any displayed traces.
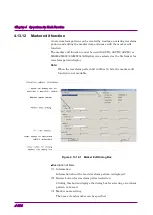
Figure 4.13.10-1 I, Q Graph
■Power graph
On the Power graph (displayed when “Power, Marker” is selected from
the Graph Type drop-down list), the sample values of the read waveform
pattern are plotted as power and adjacent samples are connected by
linear interpolation.
If ASCII1, ASCII2, ASCII3, or wvi is selected as the file format for
waveform pattern display
,
The X axis of the Power graph is displayed
with the RMS value of the waveform pattern as 0 dB. When the
MG3700A, MG3710A, ME3710E, or MG3740A actually outputs a
modulation signal, therefore, the output modulation signal is based on 0
dB of the Power graph.
MG3700A/MG3710A/MG3710E/MG3740A output level
= MG3700A/MG3710A/MG3710E/MG3740A display level + Level on Power
graph

