Chapter 4 Operations for Each Function
4-34
4.4.5 Changing graph display area and axis plot interval
The plot interval of the X axis (frequency) on the FFT graph and the data
range for FFT analysis can be changed.
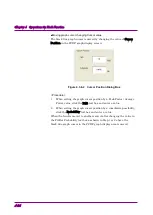
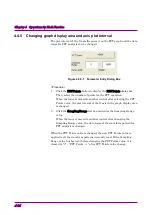
Figure 4.4.5-1 Parameter Entry Dialog Box
<Procedure>
1. Click the FFT Points button to display the FFT Points
dialog box.
Then, select the number of points for the FFT operation.
When the focus is moved to another control after selecting the FFT
Points value, the plot interval of the X axis in the graph display area
is changed.
2. Click the Sampling Range text box and enter the Sampling Range
value.
When the focus is moved to another control after changing the
Sampling Range value, the data range of the waveform pattern for
FFT analysis is changed.
When the FFT Points value is changed, the new FFT Points value is
applied to all the waveform patterns currently read. If the Sampling
Range value has been set before changing the FFT Points value, it is
cleared to “0” – “FFT Points – 1” after FFT Points value change.


