4.4 FFT Graph Display
4-29
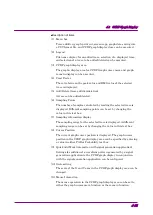
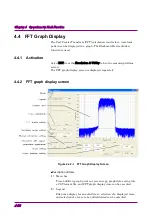
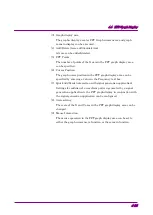
(3) Graph display area
The graphic display area for FFT Graph cursor move and graph
zoom-in display can be executed.
(4) Add/Delete (trace addition/deletion)
A trace can be added/deleted.
(5) FFT Points
The number of points of the X axis in the FFT graph display area
can be specified.
(6) Cursor Position
The graph cursor position in the FFT graph display area can be
specified by entering a value in the Frequency text box.
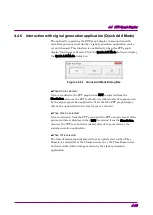
(7) Quick Add Mode (interaction with signal generation application)
Settings for addition of a waveform pattern generated by a signal
generation application to the FFT graph display in conjunction with
the signal generation application can be configured.
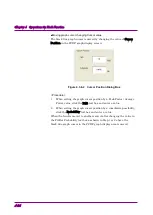
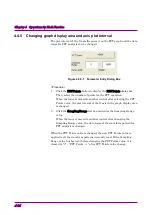
(8) Scale setting
The scale of the X and Y axes in the FFT graph display area can be
changed.
(9) Mouse Interaction
The mouse operation in the FFT graph display area can be set to
either the graph cursor move function or the zoom-in function.

