Chapter 4 Operations for Each Function
4-40
4.4.10 Printing/saving graph data
■
Printing out graph display screen
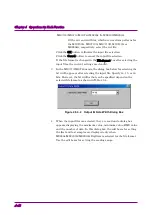
Select Print Window Image from the File menu to display the print
screen.
Set the printer, printing range, number of copies, etc., in this screen, and
print out the FFT screen (entire of the window) from the printer.
Figure 4.4.10-1 Print Window Image Button on the File Menu
■
Outputting graph data to file
Select Export Data from the File menu to display the file save screen.
Set the saving destination, etc., in this screen, and click the Save button.
Lists of Peak per Average (dB) and Probability (%) are saved to a file in
the CSV format (a text file format in which values are delimited by a
comma).
Figure 4.4.10-2 Export Data Button on the File Menu
■
Copying graph image on screen
Select Copy Graph Image from the Edit menu to copy the current graph
image on the screen to the clipboard.
Figure 4.4.10-3 Copy Graph Image Button on the Edit Menu


