Reducing Measurement Noise
At high resolutions and low measurement levels, measurement noise can
become an important factor in the accuracy of your measurements. One
possible source of measurement noise is the wiring and cabling in the test
setup. These noise sources and their effects are discussed in Chapter 7,
"Measurement Tutorial". A smaller level of noise is also inherent in the
meter itself.
To minimize the effects of noise on your measurements, use the highest
possible integration time (NPLC) and average the readings. Faster
reading rates are more susceptible to noise. Choosing the best NPLC and
averaging method for your measurement requires a tradeoff between the
reading rate and the level of acceptable noise in the resulting
measurement.
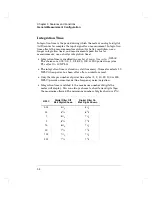
The Integration Time (NPLC) and averaging can be multiplied to create
an
equivalent NPLC
. The equivalent NPLC defines the reading rate and
characterizes the expected noise level. Averaging can be performed in the
meter by using either the digital filter or by using the statistics (Stats) mode
of operation.
Measurement noise characteristics of the meter closely match theoretical
gaussian noise distributions. The graph on the next page shows
typical
input noise measurements for the 1 mV range with the low thermal
shorting plug applied to the input terminals. Other functions and ranges
will exhibit similar noise reduction characteristics versus NPLC.
For example, if you set the NPLC to 20 and enable the digital filter
set to FAST (10 reading average), the equivalent NPLC is 200. At an
equivalent NPLC of 200, the reading rate is approximately 6 readings per
minute (digital filter fully settled) and the typical noise level expected is
1.6 nVrms.
Alternately, if you take readings every 5 minutes, you can set an
equivalent NPLC of 5000 to minimize the noise in the measurement.
An equivalent NPLC of 5000 could be obtained by setting the integration
time to 100 NPLC and enabling the digital filter set to MEDIUM (50
reading average). At this equivalent NPLC, a typical noise level
of 0.35 nVrms can be expected.
Chapter 3 Features and Functions
General Measurement Configuration
60
Содержание 34420A
Страница 1: ......
Страница 2: ......
Страница 13: ...1 Quick Start ...
Страница 31: ...2 Front Panel Operation ...
Страница 55: ...3 Features and Functions ...
Страница 117: ...4 Remote Interface Reference ...
Страница 200: ...5 Error Messages ...
Страница 213: ...6 Application Programs ...
Страница 245: ...6 Chapter 6 Application Programs Microsoft Excel Macro Example 245 ...
Страница 246: ...Chapter 6 Application Programs Microsoft Excel Macro Example 246 ...
Страница 247: ...7 Measurement Tutorial ...
Страница 274: ...8 Specifications ...
Страница 279: ...Dimensions Chapter 8 Specifications 34420A Nano Volt Micro Ohm Meter 280 ...
Страница 294: ......

