


XT2640 Operating Manual
13 July 2016
Page 57 of 187
Briefly, this is performed by –
1.
Insert the drive into the front panel USB port and wait for it to be READY.
2.
Display the screen to be recorded.
3.
Press the DRIVE INFO area of the screen, the screen shows the file export/import screen.
4.
Press the SCREEN IMAGE button. The screen changes to allowing you to enter a file name.
5.
Enter the desired file name (the extension is automatically provided).
6.
If the file already exists then you are prompted to respond if you wish to overwrite it or not.
7.
The file is then written.
12.9
GRAPHICALLY
VIEWING
PAST
MEASUREMENTS
–
THE
HISTORY
SCREEN
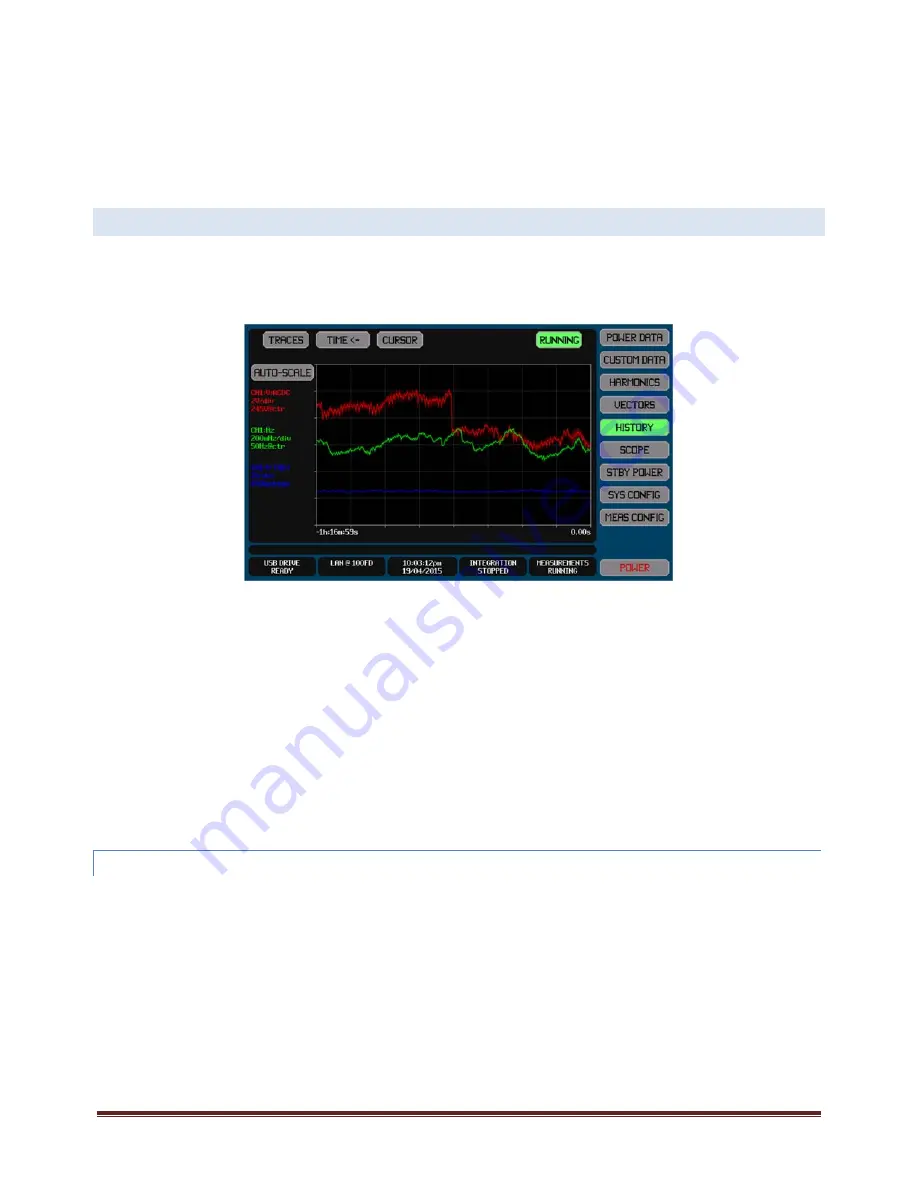
The HISTORY Screen gives you access to charts of up to four measured results vs elapsed time. All available data are always
recorded without you having to make configuration settings. The only configuration needed is that needed to select the data to
display and to format the display of those selected data, this has no effect on the recorded data. You may select to display the same
data on more than one trace, each with different scaling and offset as desired.
The HISTORY Screen can be selected for view from any of the Main Data Screens by pressing the HISTORY button.
Each trace is drawn showing the average and the extents of the data within each pixel. The average is drawn with full brightness,
while the extents are shown using a lower brightness between the lowest and highest extents. The minimum and maximum
measurements from every individual measurement period is maintained, and for individual sample based data such as peak this
gives you continuous coverage of down to 1µs resolution data for millions of years without data loss.
To the left of the chart there is textual information indicating the data selection, color, scaling and offset settings for each enabled
trace in a brief format.
Unless you have zoomed or stopped the chart, the right end of the chart is ‘now’ and the left end is when the chart was started.
Note:
If no traces are enabled to be shown on the chart then NO TRACES SELECTED is shown in the chart.
You do not have to be viewing the HISTORY screen for data to be collected.
You do not have to start RUNNING unless you specifically stopped it.
Since all available historical data are always saved while RUNNING, you are free to change traces at will without needing to
retake data, you can also reconfigure measurements at any time.
Traces are drawn in numerical order, trace 1 first, and then trace 2, and so on. So the highest numbered enabled trace is
the uppermost trace if traces overlap.
12.9.1
SELECTING
AND
CONFIGURING
THE
TRACES
TO
SHOW
The HISTORY screen traces are selected and configured by using the TRACES button at the top of the screen. The example below
shows the screen which is used to configure the traces to be shown.


