XT2640 Operating Manual
13 July 2016
Page 68 of 187
power analysis. An example of this would be performing power analysis with a 0.1 second measurement period and spectrum
analysis with a 1Hz frequency resolution (so having a 1 second MEASURING period).
This is because when the frequency resolution is set to a low value the MEASURING period for the spectrum analysis spans several
power analysis measurement periods, so any changes required due to measurements made in power analysis will interfere slightly
with the spectrum analysis being performed. If the MEASURING period is less than that of the power analysis measurement period
then these recommendations do not need to be considered typically. There are two points which may need to be considered –
Range changes could occur because of power analysis measurements if using D current option channels and they are
configured with A RANGE set for AUTO. If it is possible that a range change could occur while performing low frequency
resolution spectrum analysis then it is recommended that the AUTO A RANGE setting is not used.
To ensure that the sampling frequency of the signals is not an exact multiple of the fundamental or any harmonics of the
actual signals during power analysis, the actual sampling frequency is slightly modified in ‘real‐time’ to prevent this. These
slight changes in the sampling frequency slightly broaden the effective bandwidth of the spectrum analysis results. If you
wish to have the best performance for spectrum analysis when using a low frequency resolution and also using a high ratio
between the resolution and maximum frequencies then it is recommended to use a FIXED FUND setting for power analysis
(or a NO FUND setting) which prevents this from occurring.
12.13.3
HOLDING
MEASUREMENTS
WHILE
PERFORMING
SPECTRUM
ANALYSIS
Measurements can be held and released as described in section 12.2.6.
If a measurement hold is imposed during the MEASURING phase of spectrum analysis then the measurement being collected is
abandoned and the displayed spectrum remains at that last shown.
If a measurement hold is imposed during the PROCESSING phase of spectrum analysis then the processing continues and the results
of this processing will subsequently be displayed when this phase completes, but any further measurements will not be performed
until the measurement hold is released.
12.13.4
VIEWING
SPECTRUM
ANALYSIS
RESULTS
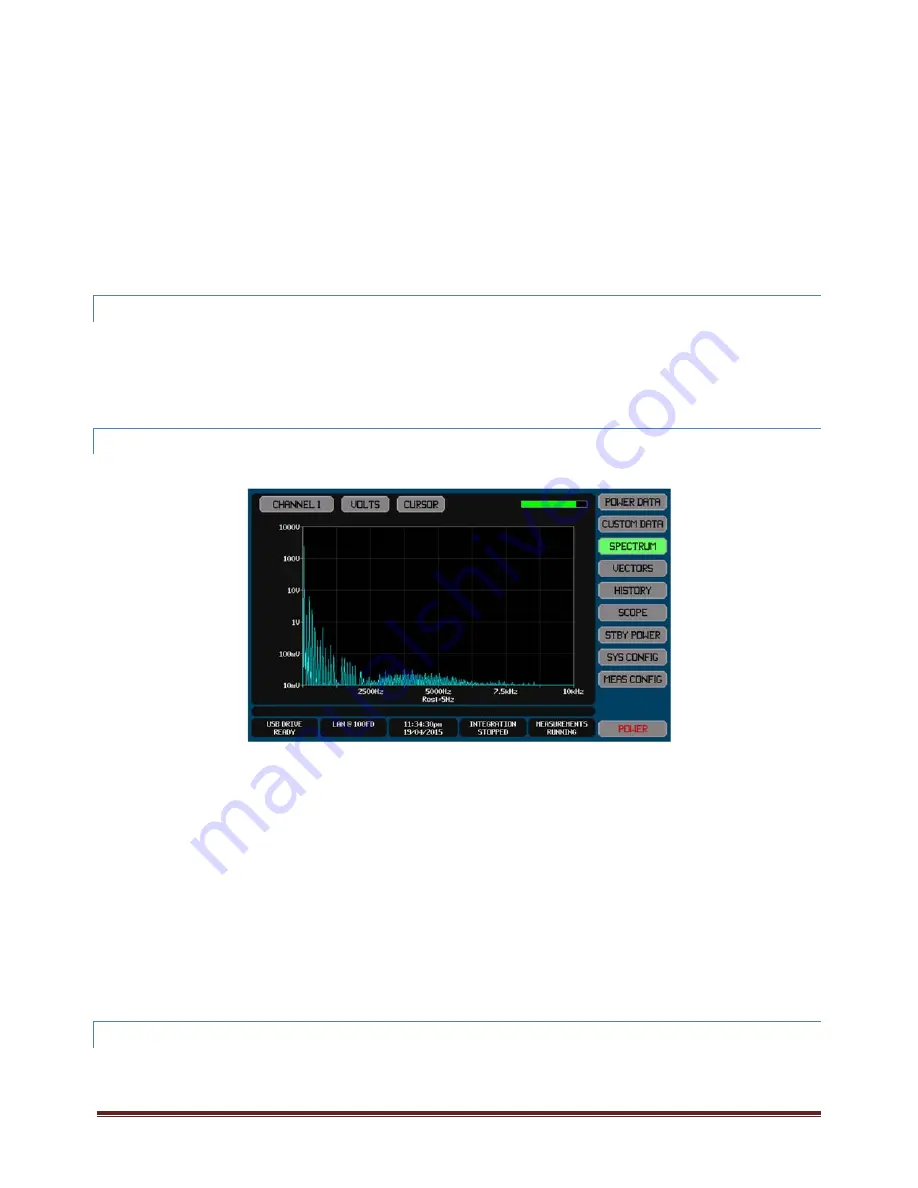
When operating in SPECTRUM mode, the HARMONICS screen button shown on the right side of most screens is replaced by a
SPECTRUM button. Pressing this button enables the results of the spectrum analysis to be viewed on the SPECTRUM screen.
If the spectrum takes more than nominally ½ second to perform either phase of the analysis then a status bar is displayed (as shown
on the example screen above) which indicates the percentage completion of the MEASURING phase and the PROCESSING phase as
appropriate.
The CHANNEL button allows you to select which channel you are viewing the spectrum of.
The VOLTS/AMPS/WATTS button allows you to select which signal in the selected channel you are viewing the spectrum of.
The CURSOR button allows you to turn on/off a moveable cursor which allows you to obtain a numerical reading of the spectrum
content at a specific frequency. If shown, the cursor may be moved one pixel to the left or right by using the <‐ and ‐> buttons, or you
may drag the cursor on the screen by pressing within the chart area.
Note:
The settings on this screen only affect which spectrum is displayed; all spectra are obtained independently of the settings
on this screen.
When a cursor is shown, the XT2640 automatically detects the highest signal content within the range of frequencies
covered by the single pixel at which the cursor is positioned, displaying the frequency and amplitude of that maximum
signal. If no measured frequency falls within the cursor position pixel then it finds the largest spectral content at the
adjacent frequencies which have been measured.
When displaying a WATTS spectrum, the chart shows a plot of the absolute value of watts at each frequency point.
12.13.5
EXPORTING
OR
RECORDING
SPECTRUM
DATA
The methods for performing this are fully described in section 23.
The SPECTRUM data can be exported to a .CSV format textual file on an external USB drive attached to the front panel USB port. This
file contains a tabulation of all frequency points for all channels.


