Single Scan Operation
4-7
NOTE –
Because the camera is mounted at the right side of the stylus, during a scan the
video image shows the sample moving from right to left below the stylus. In actuality, during
a scan the stage is moving from back to front.
•
After the scan is complete, the stylus lifts off the surface, and the stage returns to the location
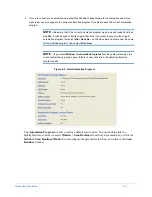
where the scan originated. The profiler then automatically replots and rescales. The image
displayed on the monitor should resemble
, which includes the following elements in
addition to scan profile and reference/measurement cursor functions:
•
List of user-set scan parameters
•
List of analytical results (if any analytical functions were selected for this scan)
•
A Watch List, which provides real-time monitoring of ASH (delta average step height),
horizontal distance, and vertical distance.
NOTE –
On all grids in the
Data Plot
window, you can move a column margin by double-
clicking and dragging the compass-shaped cursor to the desired position. Double-click, and
the system auto-sizes the column.
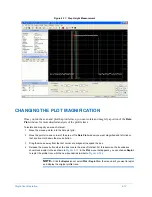
Figure 4-6: Data Plot Window after Scan Completion
Summary of Contents for Dektak 150
Page 1: ......
Page 7: ......
Page 17: ......
Page 81: ......
Page 105: ......
Page 149: ......
Page 191: ......
Page 251: ......
Page 257: ...A 6 Facilities Specifications Figure A 6 Dektak 150 without Enclosure Side View ...
Page 258: ...Facilities Specifications A 7 Figure A 7 Dektak 150 Dimensions without Enclosure Top View ...
Page 259: ...A 8 Facilities Specifications Figure A 8 Dektak 150 without Enclosure Center of Mass ...
Page 273: ......
Page 283: ......
Page 321: ......
Page 331: ......
Page 333: ......
Page 336: ......
Page 337: ......
Page 349: ......

