Analytical Functions
6-13
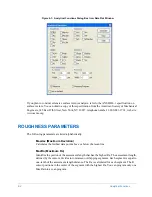
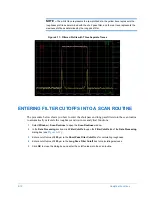
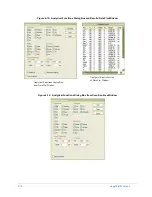
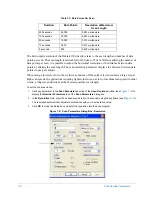
Figure 6-12: Filter Cutoffs Tab of the Data Processing Dialog Box
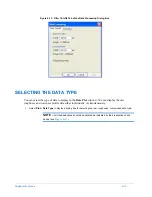
SELECTING THE DATA TYPE
You can select the type of data to display in the
Data Plot
window. You can display the raw,
roughness, and waviness profile data either individually or simultaneously.
1
Select
Plot
>
Data Type
to display a dialog box for selecting the raw, roughness, or waviness data type.
NOTE –
All three selections should be activated as indicated by their respective check
boxes (see
).
Summary of Contents for Dektak 150
Page 1: ......
Page 7: ......
Page 17: ......
Page 81: ......
Page 105: ......
Page 149: ......
Page 191: ......
Page 251: ......
Page 257: ...A 6 Facilities Specifications Figure A 6 Dektak 150 without Enclosure Side View ...
Page 258: ...Facilities Specifications A 7 Figure A 7 Dektak 150 Dimensions without Enclosure Top View ...
Page 259: ...A 8 Facilities Specifications Figure A 8 Dektak 150 without Enclosure Center of Mass ...
Page 273: ......
Page 283: ......
Page 321: ......
Page 331: ......
Page 333: ......
Page 336: ......
Page 337: ......
Page 349: ......


