6-12
Analytical Functions
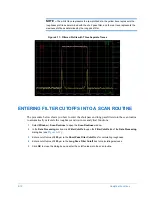
NOTE –
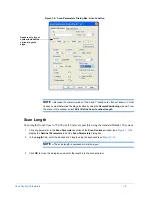
The white trace represents the raw profile data, the yellow trace represents the
roughness profile as determined with the short pass filter, and the red trace represents the
waviness profile as determined by the long pass filter.
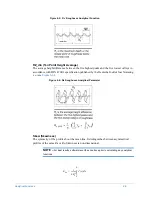
Figure 6-11: Filtered Profile with Three Separate Traces
ENTERING FILTER CUTOFFS INTO A SCAN ROUTINE
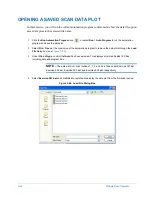
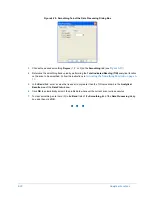
The procedure below shows you how to enter the short pass and long pass filters into the scan routine
to automatically calculate the roughness and waviness analytical functions.
1
Select
Window
>
Scan Routines
to open the
Scan Routines
window.
2
In the
Data Processing
section, click
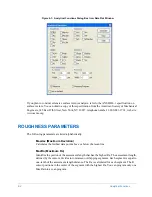
Filter Cutoffs
to open the
Filter Cutoffs
tab of the
Data Processing
dialog box (see
3
Enter a cutoff value of
200
µm in the
Short Pass Filter Cutoff
box for calculating roughness.
4
Enter a cutoff value of
200
µm in the
Long Pass Filter Cutoff
box for calculating waviness.
5
Click
OK
to close the dialog box and enter the cutoff values into the scan routine.
Summary of Contents for Dektak 150
Page 1: ......
Page 7: ......
Page 17: ......
Page 81: ......
Page 105: ......
Page 149: ......
Page 191: ......
Page 251: ......
Page 257: ...A 6 Facilities Specifications Figure A 6 Dektak 150 without Enclosure Side View ...
Page 258: ...Facilities Specifications A 7 Figure A 7 Dektak 150 Dimensions without Enclosure Top View ...
Page 259: ...A 8 Facilities Specifications Figure A 8 Dektak 150 without Enclosure Center of Mass ...
Page 273: ......
Page 283: ......
Page 321: ......
Page 331: ......
Page 333: ......
Page 336: ......
Page 337: ......
Page 349: ......

