SeaBat Sonar UI - User Manual
Operation
69
4.11.4 Wedge
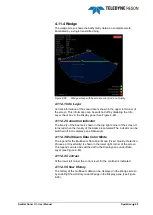
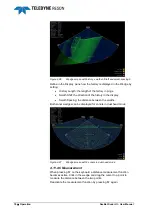
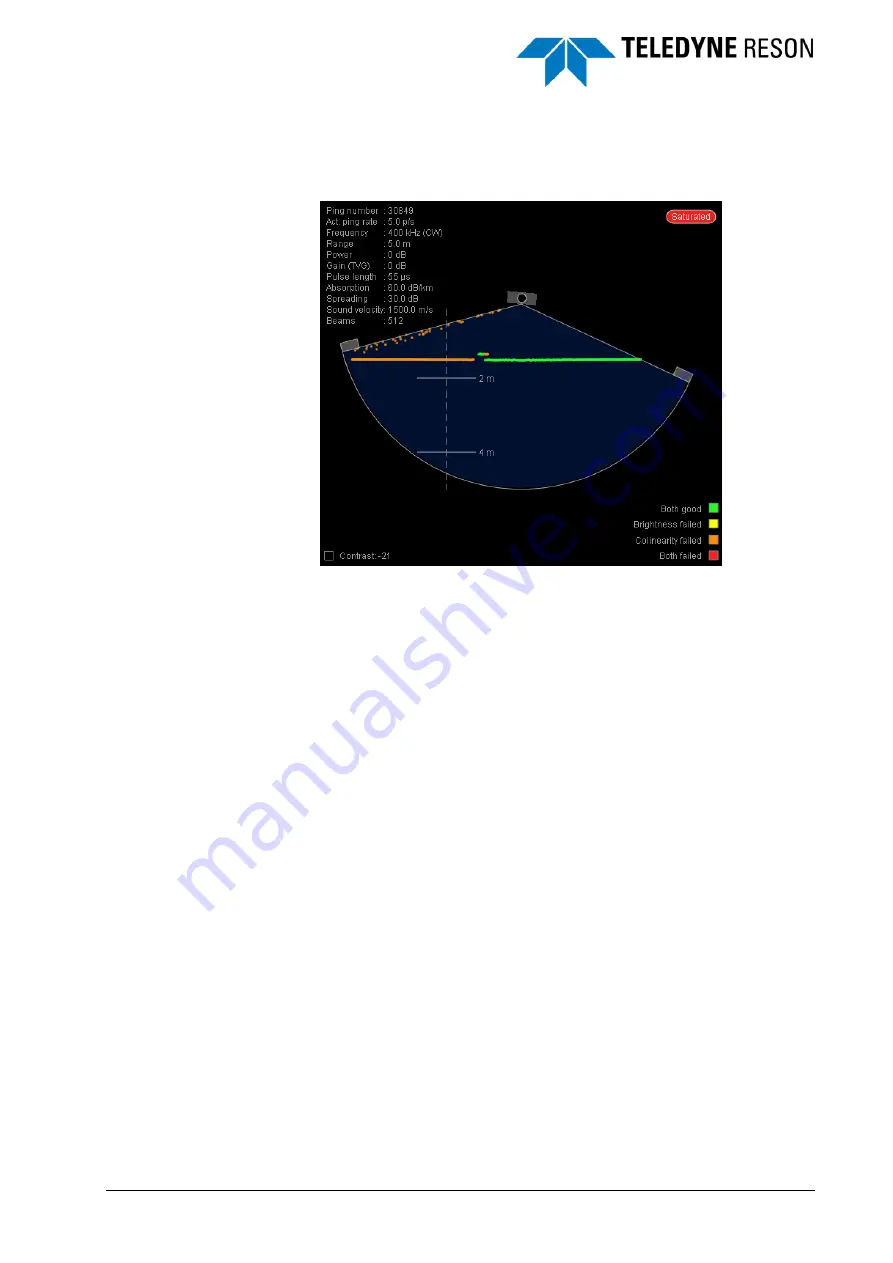
The wedge screen shows the bathymetry data as a complete swath
illuminated by a single transmitted ping.
Figure 4-85
Wedge screen with beam data color mode on Quality
4.11.4.1 Info Layer
Current information of the sonar data is shown in the upper left corner of
the screen. This information can be switched off by disabling the Info
Layer check box in the Display pane (See Figure 4-48).
4.11.4.2 Saturation indicator
The itensity of the beams is shown in the top right corner of the screen. It
turns red when the itensity of the beams is saturated.The indicator can be
switched off in the display pane Data Layer.
4.11.4.3 Multibeam Data Color Mode
The legend for the Multibeam Data Color Mode (
Fixed
,
Quality
,
Detection
Process,
or
Uncertainty
) is shown in the lower right corner of the screen.
This legend can also be switched off in the Display pane under Data
Layer (see Figure 4-48
.
4.11.4.4 Contrast
At the lower left corner the current level for the contrast is indicated.
4.11.4.5 Show History
The history of the multibeam data can be displayed in the Wedge screen
by enabling Show History under Wedge in the Display pane (see Figure
4-48).

