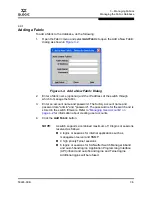
3 – Managing Fabrics
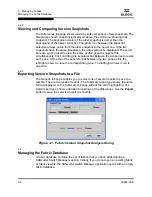
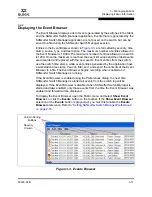
Displaying Fabric Information
3-10
59226-00 B
S
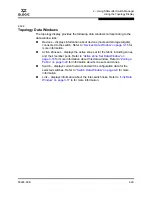
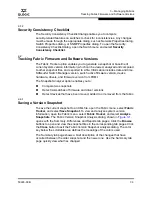
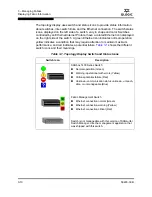
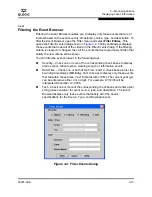
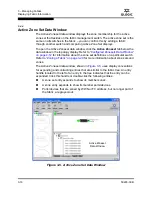
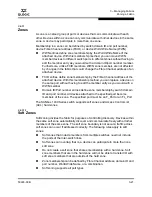
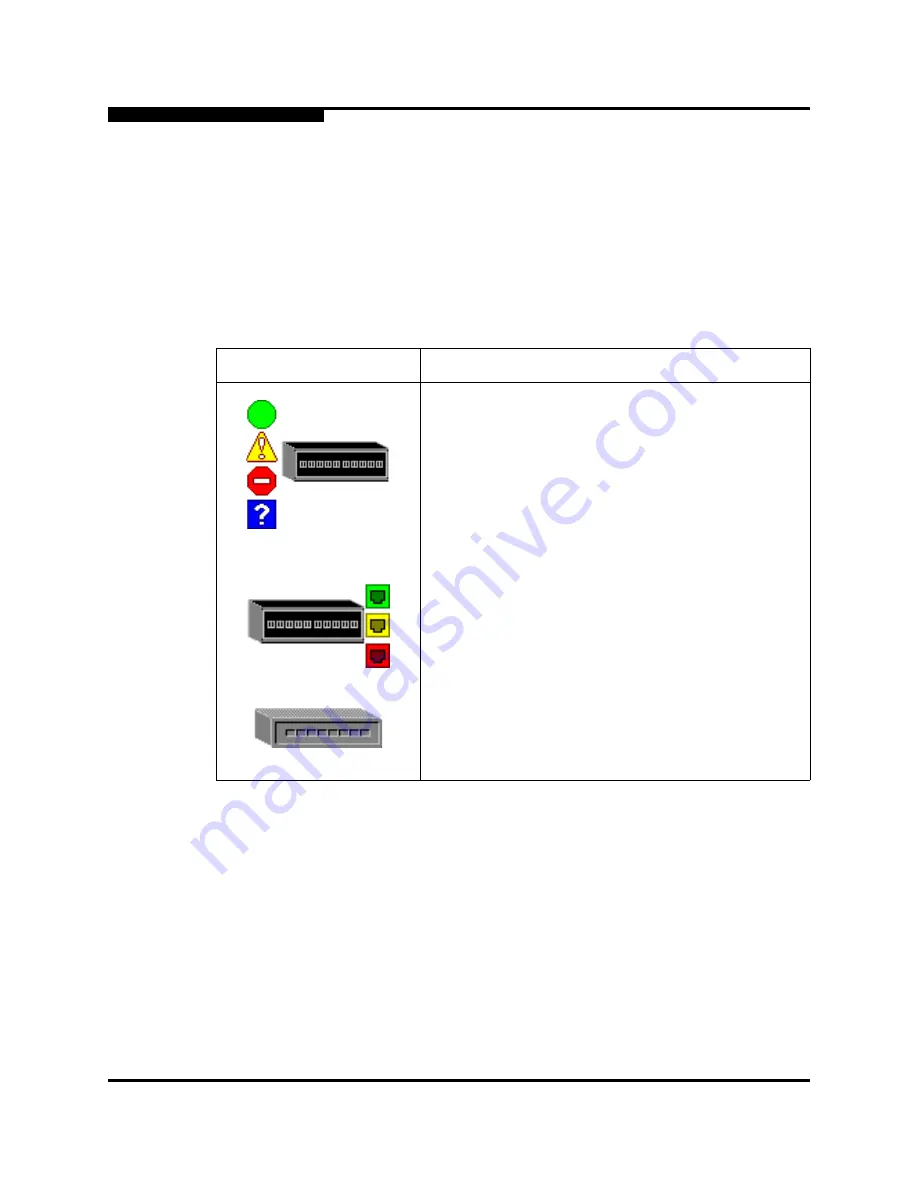
The topology display uses switch and status icons to provide status information
about switches, inter-switch links, and the Ethernet connection. The switch status
icons, displayed on the left side of a switch, vary in shape and color. Switches
controlled by an Ethernet Internet Protocol have a colored Ethernet icon displayed
on the right side of the switch. A green Ethernet icon indicates normal operation,
yellow indicates a condition that may require attention to maintain maximum
performance, and red indicates a potential failure.
Table 3-1
shows the different
switch icons and their meanings.
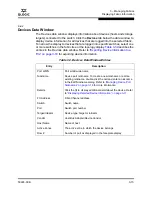
Table 3-1. Topology Display Switch and Status Icons
Switch Icon
Description
SANbox 1400 Series Switch
Normal operation (Green)
Warning–operational with errors (Yellow)
Critical–potential failure (Red)
Unknown–communication status unknown, unreach-
able, or unmanageable (Blue)
Fabric Management Switch
Ethernet connection normal (Green)
Ethernet connection warning (Yellow)
Ethernet connection critical (Red)
Switch is not manageable with this version of SANsurfer
Switch Manager. Use the management application that
was shipped with this switch.
Summary of Contents for SANbox 1400 Series
Page 12: ...Page xii 59226 00 B SANbox 1400 Series Switch Management User s Guide S Notes...
Page 126: ...4 Managing Switches Displaying Hardware Status 4 38 59226 00 B S Notes...
Page 154: ...5 Managing Ports Graphing Port Performance 5 28 59226 00 B S...
Page 265: ...A Command Line Interface Zoning Command 59226 00 B A 111 A...
Page 266: ...A Command Line Interface Zoning Command A 112 59226 00 B S Notes...


