
3 – Managing Fabrics
Displaying Fabric Information
59226-00 B
3-9
A
5.
Reset the replacement switch to activate the configuration formerly
possessed by the failed switch including the domain ID and the zoning
database. Open the Switch menu and select
Reset Switch
.
6.
Reconnect the inter-switch links, target devices, and initiator devices to the
replacement switch using the same ports as were used on the failed switch.
3.4
Displaying Fabric Information
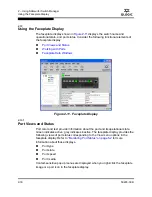
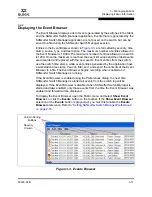
The topology display is your primary tool for monitoring a fabric. The graphic
window of the topology display provides status information for switches,
inter-switch links, and the Ethernet connection to the management workstation.
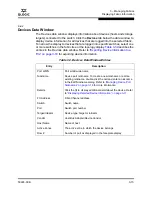
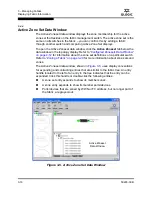
The data window tabs show device, switch, and active zone set information. The
Active Zoneset tab shows the zone definitions for the active zone set. Refer to
“Devices Data Window” on page 3-15
and
“Switch Data Window” on page 4-8
for
information about the Devices and Switch data windows.
3.4.1
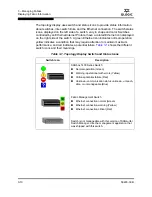
Fabric Status
The fabric updates the topology and faceplate displays by forwarding changes in
status to the management workstation as they occur. You can allow the fabric to
update the display status, or you can refresh the display at any time. To refresh
the topology display, do one of the following:
Click the
Refresh
button.
Open the View menu and select
Refresh
.
Press the F5 key.
Right-click anywhere in the background of the topology display and select
Refresh Fabric
from the popup menu.
Summary of Contents for SANbox 1400 Series
Page 12: ...Page xii 59226 00 B SANbox 1400 Series Switch Management User s Guide S Notes...
Page 126: ...4 Managing Switches Displaying Hardware Status 4 38 59226 00 B S Notes...
Page 154: ...5 Managing Ports Graphing Port Performance 5 28 59226 00 B S...
Page 265: ...A Command Line Interface Zoning Command 59226 00 B A 111 A...
Page 266: ...A Command Line Interface Zoning Command A 112 59226 00 B S Notes...


