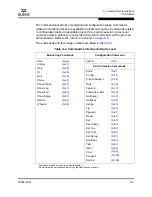
5 – Managing Ports
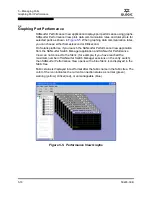
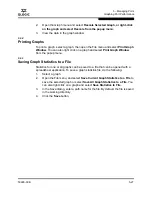
Graphing Port Performance
59226-00 B
5-25
A
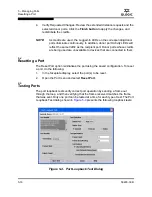
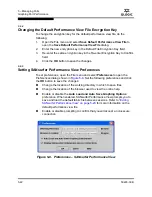
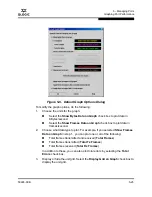
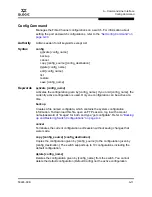
Figure 5-9. Default Graph Options Dialog
To modify the graph options, do the following:
1.
Choose the units for the graph:
Select the
Show Bytes Data on Graph
check box to plot data in
KBytes/second
Select the
Show Frames Data on Graph
check box to plot data in
frames/second.
2.
Choose what data type to plot. For example, if you selected
Show Frames
Data on Graph
in step 1., you can plot one or all of the following:
Total frames transmitted and received (
Total Frames
)
Total frames transmitted (
Total Tx Frames
)
Total frames received (
Total Rx Frames
)
In addition to these, you can also plot total errors by selecting the
Total
Errors
check box.
3.
Display or hide the unit grid. Select the
Display Grid on Graph
check box to
display the unit grid.
Summary of Contents for SANbox 1400 Series
Page 12: ...Page xii 59226 00 B SANbox 1400 Series Switch Management User s Guide S Notes...
Page 126: ...4 Managing Switches Displaying Hardware Status 4 38 59226 00 B S Notes...
Page 154: ...5 Managing Ports Graphing Port Performance 5 28 59226 00 B S...
Page 265: ...A Command Line Interface Zoning Command 59226 00 B A 111 A...
Page 266: ...A Command Line Interface Zoning Command A 112 59226 00 B S Notes...


