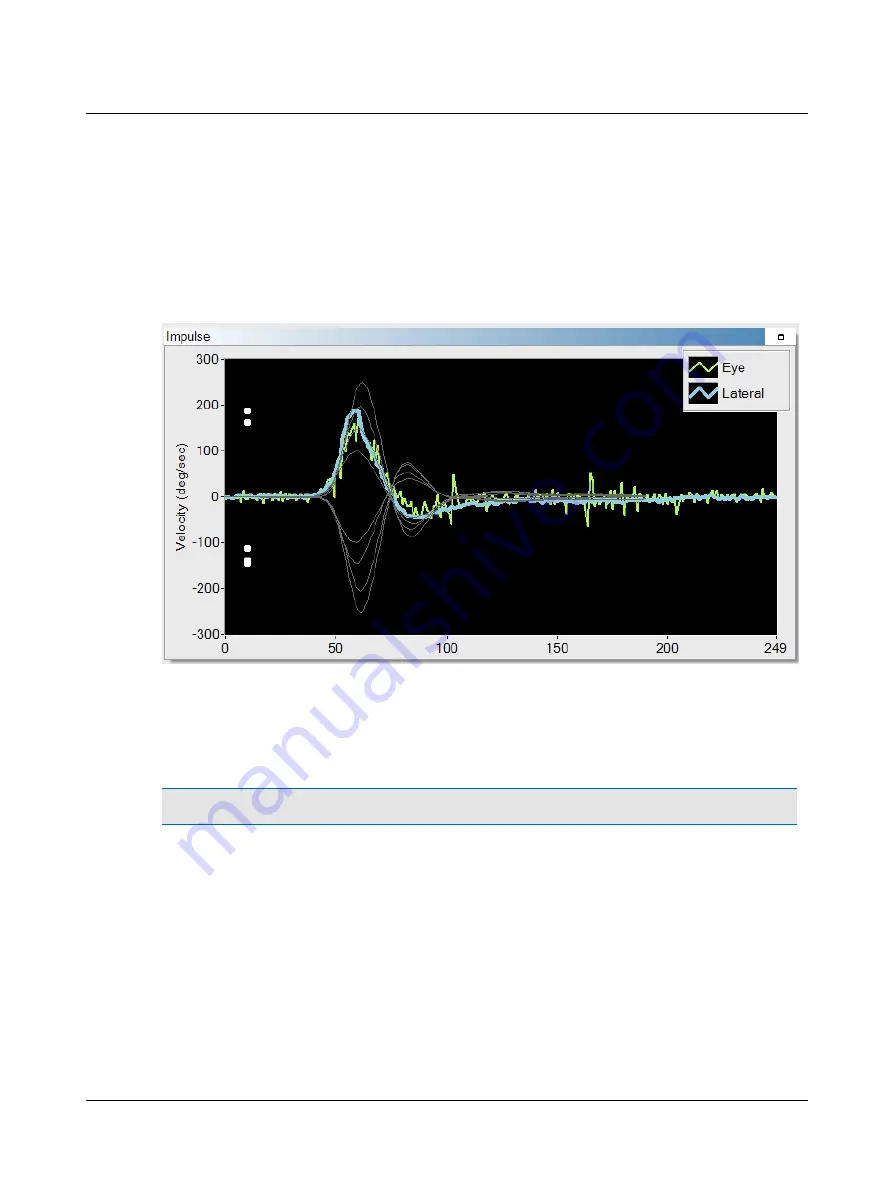
Impulse window
In this window, the gray training curves represent the shape of good head impulses at a variety of velocities: 100, 150, 200,
and 250. The shape of the training curves changes based on the type of impulse selected (Lateral, LARP, RALP). The head
trace displayed in orange and with negative velocities represents movement to the right. The head trace displayed in blue
and with positive velocities represents movement to the left.
The actual head and eye traces are superimposed on top of the gray training curves. The eye trace is represented in green.
White dots display along the Y axis to indicate the velocities of impulses collected.
The collection algorithm analyzes the data in real-time as it is being collected. If the head impulse meets the algorithm cri-
teria, an accepted head impulse will be counted in the collection window. A head impulse that matches the training curve
is typically counted as an accepted (valid) head impulse.
Comparing the actual head traces (in this example shown in blue) against the training curves helps ensure that the tester
performs quality head impulses and that only good data is included in the analysis.
Note
•
You can find more information in the ICS Impulse training video or at
www.icsimpulse.com
.
58
Otometrics - ICS Impulse USB
9 Head Impulse


