PV8959-F4E005 46
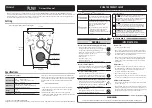
7.2.[GRAPH] window
Spectral measured value data is displayed using a graph.
Data name
Cursor
Data graph
Graph type
㻌
Menu
Description
Graph type
Displays the type of a graph; the type displayed during the
completion of measurement is determined by setting the
graph type (GRAPH) of a graph setting file. The graph
type is changed by double-clicking the mouse. (However,
a graph setting file is not changed by double-click
operation.)
Data name
Displays the name of each color in a data graph; a NAME
input window appears when you click the mouse. [Data
name] and [Data contents] can be changed on the
window.
Data graph
This is the result data of spectral measured values.
Cursor
Displays the position of a cursor operated on an [INFO]
window; just after measurement, the cursor is located in
the minimum value of the spectral reflection and
transmission factor values.
SAVE
[SAVE] can be selected when you click the right button of
the mouse. The current image is saved. JPEG or BMP
can be selected as the saving format.
COPY
[COPY] can be selected when you click the right button of
the mouse. The current image is copied to the clipboard.