PV8344F4E013
39
4.18. Checking the results
For details on the main window of the software, refer to
Chapter 4 Main Window
in the
USPM-SA Software Operation Manual
.
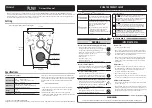
(1) GRAPH
window
The GRAPH window displays the result of spectroscopic reflectance measurement.
The vertical axis indicates the reflectance, and the horizontal axis the wavelength.
(2) TEXT
window
The TEXT window shows the values of the measurement result.
(7) THICKNESS INFO window
(8) THICKNESS window
(3) DIAGRAM window
(1) GRAPH window
(2) TEXT window
(4) Operation panel
(detailed values)
File menu
(6) LUMINANCE TEXT window
(5) LUMINANCE window