PV8959-F4E005 38
6.4.Graph setting
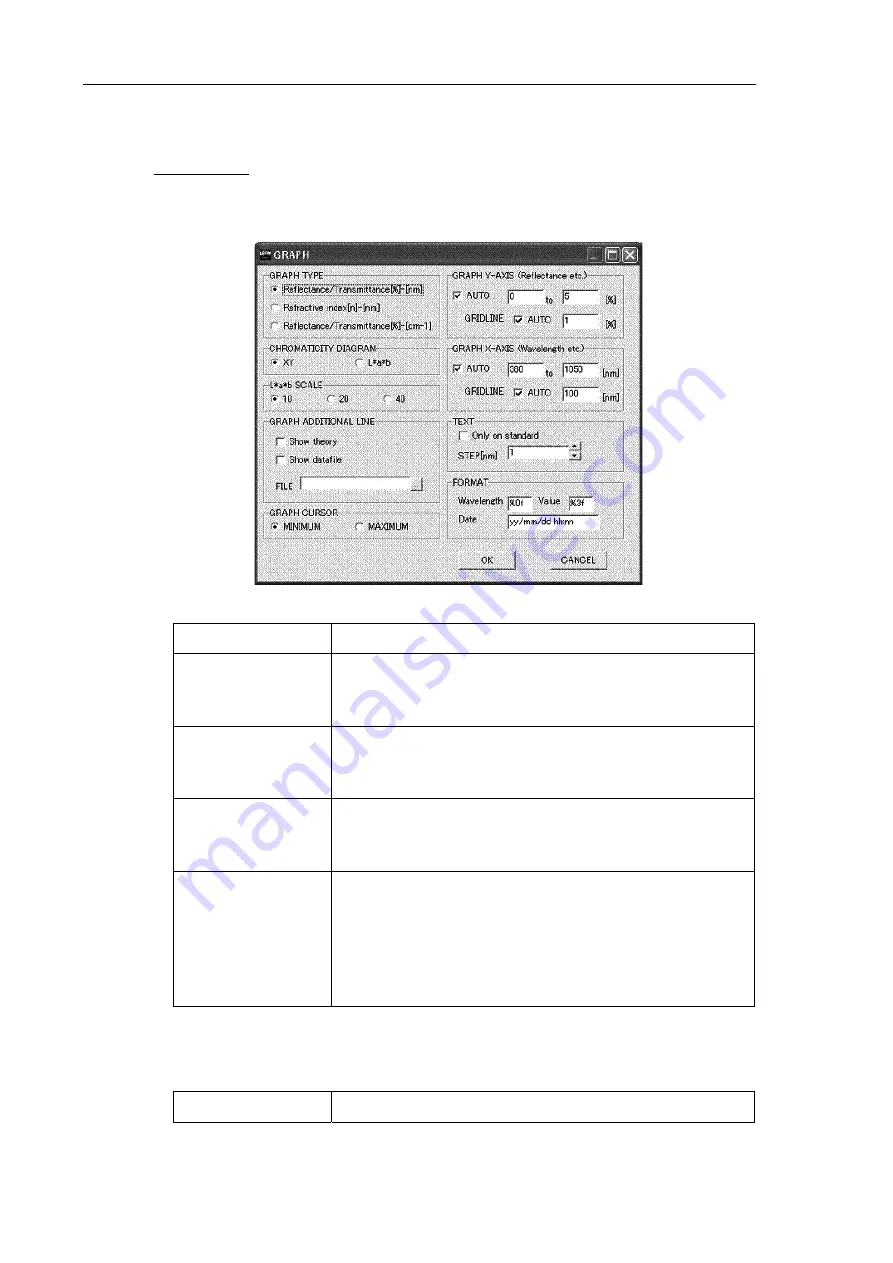
Select [Setup] - [Graph] from the file menu. A GRAPH setting window appears. A graph
setting file can be changed on the GRAPH setting window.
㻌
Menu
Description
Graph type
Select the type of a graph on a [GRAPH] window. The
type of the graph set here is displayed just after a value is
measured.
Chromaticity
diagram
Select the type of chromaticity diagram on a [DIAGRAM]
window. The type of chromaticity diagram set here is
displayed just after a value is measured.
L*a*b scale
Select a display scale when the chromaticity diagram
displayed on a [DIAGRAM] window is an L*a*b
chromaticity diagram.
Graph additional
line
Displays auxiliary data on a [GRAPH] window; enable
[Show theory] when displaying the theoretical value of a
reference. When displaying the saved data, enable [Show
userfile] and set a filename. Only the first data can be
displayed in this case. [Show theory] and [Show userfile]
can be set simultaneously.
format
Sets the display format on each window; [Wavelength]


