


U
SING
G
ROUPS
- 189 -
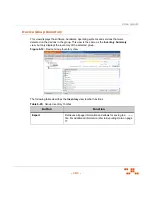
Dashboard Charts
The following table describes all of the available charts.
Table 6-24:
Dashboard Charts
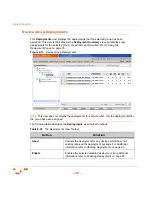
Chart
Description
Vulnerability Severity
This chart displays the percentage of un-remediated
applicable vulnerabilities vs. applicable vulnerabilities
grouped by vulnerability severity.
Vulnerability Severity by
Device
This chart displays the percentage of un-remediated
devices vs. applicable devices grouped by vulnerability
severity.
Scheduled Remediation
This chart displays the percentage of un-remediated
devices with a scheduled remediation vs. un-remediated
devices grouped by vulnerability severity.
Mandatory Baseline
Compliance
This chart displays the percentage of devices grouped by
mandatory baseline compliance.
Incomplete Deployments
This chart displays the percentage of incomplete
deployments grouped by the deployments percentage
complete.
Agent Status
This chart displays the percentage of agents grouped by
status.
Time since last DAU
This chart displays the percentage of available or working
devices grouped by time since the last successful
Discover Applicable Updates task.
Offline Agents
This chart displays the percentage of offline agents
grouped by the time offline.
Summary of Contents for ZENWORKS PATCH MANAGEMENT 6.4 SP2 - SERVER
Page 1: ...User Guide ZENworks Patch Management 6 4 SP2 ...
Page 44: ...USING ZENWORKS PATCH MANAGEMENT 28 ...
Page 138: ...WORKING WITH DEPLOYMENTS 122 ...
Page 212: ...USING GROUPS 196 ...
Page 236: ...REPORTING 220 ...
Page 308: ...CONFIGURING DEFAULT BEHAVIOR 292 ...
Page 332: ...USING THE AGENT 316 The Agent Control Panel opens Figure 10 19 Agent Control Panel ...