
6.
In the Connection Type pane, view information about the configured connection type for the selected container
which can be NFS, CIFS, NFS/CIFS, RDS, or OST (the following example shows an NFS/CIFS container):
– NFS Connection Configuration pane—NFS access path, Client Access, NFS Options, Map root to.
– CIFS Connection Configuration pane—CIFS share path, Client Access.
– If the container is an RDA connection type container, the Connection Type OST pane or Connection Type RDS
— displays three tabs: Capacity, Duplication, and Client Statistics. The Capacity tab displays a Capacity pane
with Status, Capacity, Capacity Used, and Total Images. The Duplication tab displays a Duplication Statistics
pane with Inbound and Outbound statistics in the following categories: Bytes Copied (logical), Bytes
Transferred (actual), Network Bandwidth Settings, Current Count of Active Files, and Replication Errors. The
Client Statistics tab displays a Client Statistics pane with Images Ingested, Images Complete, Images
Incomplete, Images Restored, Bytes Restored, Image Restore Errors, Image Ingest Errors, Bytes Ingested,
Bytes Transferred, and Network Savings.
7.
In the Replication pane (for NFS/CIFS connection types), view the replication information for the selected container
in the following panels:
– Replication Configuration—Enable, Role, Remote Container Name, Bandwidth, and encryption.
– Replication Status—Peer State, Replication State, Replication Average Transfer Rate, Replication Peak
Transfer Rate, Network Average Transfer Rate, Network Peak Transfer Rate, Estimated Time to Sync (in days,
hours, minutes, and seconds), Savings (in percentage), Last INSYNC Time (yyyy-mm-dd hh:mm:ss), and
Schedule Status (next starting time in days, hours, minutes, and seconds).
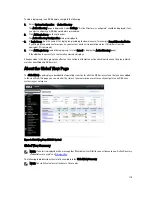
Monitoring Replication Statistics
Click Dashboard
→
Replication Statistics to display and monitor replication statistics for one (or more) containers, and
one (or more) peer DR Series systems selected in the Replication Filter pane. Depending upon the configured settings,
you can monitor and display replication statistics for:
•
All containers
•
One or more specific containers
•
One or more peer DR Series systems
The Replication Filter pane contains 10 Headers check boxes that when selected display replication statistics for the
container(s) or other peer DR Series system(s) you select in Container Filter.
After selecting the container(s), peer system(s), and the replication statistic categories, click Apply Filter to display the
replication statistics results based on the search criteria you selected.
Using the Replication Statistics page, you can selectively filter and display specific types of related replication statistics
for all, one or more than one container, or one or more other peer DR Series systems.
For more information about Replication statistics, see
Displaying Replication Statistics
,
Container Filter
, and
Displaying
the Replication Statistics Page
.
110
Summary of Contents for DR series
Page 1: ...Dell DR Series System Administrator Guide ...
Page 10: ...10 ...
Page 34: ...34 ...
Page 138: ...138 ...
Page 160: ...160 ...


