Viewing the System Alerts
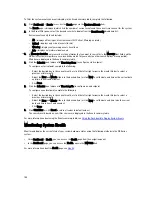
To use the DR Series navigation panel to display the current number of system alerts, complete the following:
1.
Click Dashboard
→
Alerts in the navigation panel.
The Alerts page is displayed, which lists the number of system alerts in the System Alerts summary table, and
provides the current timezone (for example, US/Pacific).
2.
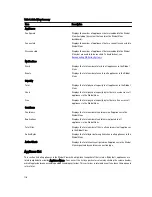
Review the system alerts listed in the System Alerts summary table, which identifies each alert by:
– Index number (for example: 1, 2, ...).
– Timestamp (in yyyy-mm-dd hh:mm:ss format; for example, 2012–10–30 10:24:53).
– Message (a brief description of the alert; for example,
Network Interface Controller Embedded (LOM) Port 2
disconnected. Connect it to a network and/or check your network switches or routers for network connectivity
issues
).
Monitoring System Events
You can monitor the DR Series system events, and filter events you want to display using the Event Filter pane in the
Events page. This page can display All system events, or you can restrict the events to only one of the following types:
Info (Informational), Warning, or Critical events.
The Events page lets you search for system events and monitor the current state of the DR Series system based on the
system events that match your search criteria. For more information about using the Event Filter pane, see
Using the
Event Filter
.
To monitor the system, using either of the following methods to display the Events page:
•
In Dashboard page, click the Number of Events link in the Events page.
•
In the navigation panel, click Dashboard
→
Events to display the Events page.
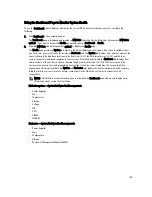
Using the Dashboard to Display System Events
To use the Dashboard page to display the current number of system events (Number of Events), complete the following:
NOTE: This method in convenient when you are already at the Dashboard page and want to display the current
system events.
1.
In the Dashboard page, click the Number of Events link in the System Status bar (for example, Number of Events: 2).
The Events page is displayed and lists the total number of current events, the Event Filter, the Events summary
table, and the current time zone.
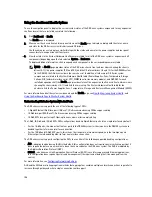
2.
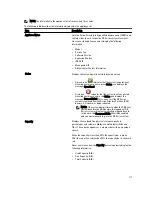
In the Event Filter pane, you can select to filter events by using the Event Severity pull-down list, and setting the
Timestamp From and Timestamp To starting and ending setpoints.
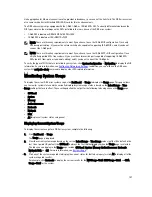
3.
In the Event Severity pull-down list, select the severity level of events that you want to filter and display (All,
Critical, Warning, or Info).
4.
In Message Contains, enter a word or string of words you want to search for in the Message text field, and the DR
Series system will perform a case-insensitive match for your entry (no other search options are supported).
Matches are displayed in the Events summary table.
102
Summary of Contents for DR series
Page 1: ...Dell DR Series System Administrator Guide ...
Page 10: ...10 ...
Page 34: ...34 ...
Page 138: ...138 ...
Page 160: ...160 ...

