


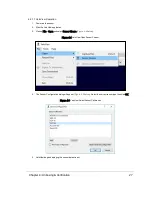


4.2.3 Visualize Live Sensor Data with VeloView
Now that the computer can access the sensor’s Web Interface, it’s time to get a first look at the sensor’s data.
Note: VeloView is an open source visualization and recording application tailored for Velodyne LiDAR sensors. Other
visualization software (e.g. ROS, DSR and PCL) can perform similar functions and may be used instead.
VeloView is documented in more detail in
VeloView on page 108
. If the application isn’t already on the computer, perform
the procedure detailed in
Install VeloView on page 109
. Older versions should be updated to at least the version installed
by following the procedure.
26
VLP-32C User Manual
Содержание VLP-32C
Страница 1: ...VLP 32C User Manual 63 9325 Rev C...
Страница 65: ...Figure 9 7 Single Return Mode Timing Offsets in s Chapter 9 Sensor Data 65...
Страница 104: ...C 2 VLP 32C Mechanical Drawing Figure C 2 VLP 32C MechanicalDrawing 86 0130 Rev 1 104 VLP 32C User Manual...
Страница 106: ...D 1 Interface Box Wiring Diagram Figure D 1 Interface Box Wiring Diagram 86 0107A 106 VLP 32C User Manual...
Страница 107: ...D 2 Interface Box Schematic Figure D 2 Interface Box Schematic 69 8230A Appendix D Wiring Diagrams 107...