


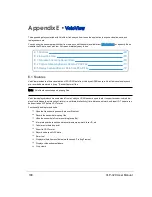


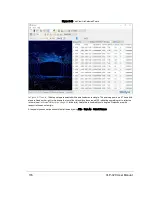


Figure E-7 VeloView Spreadsheet Tool
A sidebar of tabular data is displayed to the right of the rendered frame, containing all data points in the frame.
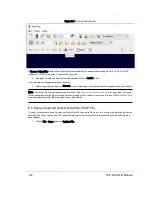
6. Adjust the columns to get a better view of the numbers. If you’ve adjusted columns in Excel, some of this will be
familiar. You can change column widths by dragging the column header divider left or right, and by double-clicking
them. Drag column headers left or right to reorder them. Sort the table by clicking column headers. And you can
make the table itself wider by dragging the table’s sides left or right. Make Points_m_XYZ wider to expose the
XYZ points themselves.
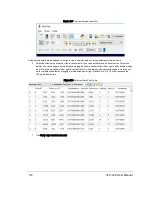
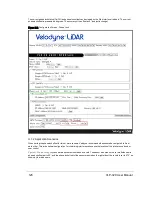
Figure E-8 VeloView Data Point Table
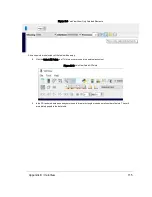
7. Click Show only selected elements.
114
VLP-32C User Manual
Содержание VLP-32C
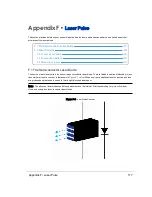
Страница 1: ...VLP 32C User Manual 63 9325 Rev C...
Страница 65: ...Figure 9 7 Single Return Mode Timing Offsets in s Chapter 9 Sensor Data 65...
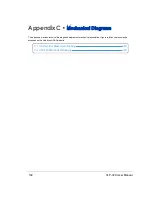
Страница 104: ...C 2 VLP 32C Mechanical Drawing Figure C 2 VLP 32C MechanicalDrawing 86 0130 Rev 1 104 VLP 32C User Manual...
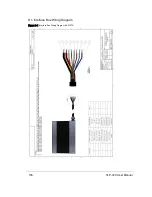
Страница 106: ...D 1 Interface Box Wiring Diagram Figure D 1 Interface Box Wiring Diagram 86 0107A 106 VLP 32C User Manual...
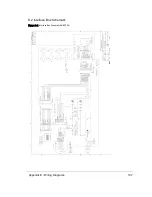
Страница 107: ...D 2 Interface Box Schematic Figure D 2 Interface Box Schematic 69 8230A Appendix D Wiring Diagrams 107...