UAD‑2 Live Rack Manual
Chapter 5: UAD Meter & Control Panel
121
UAD Meter Window
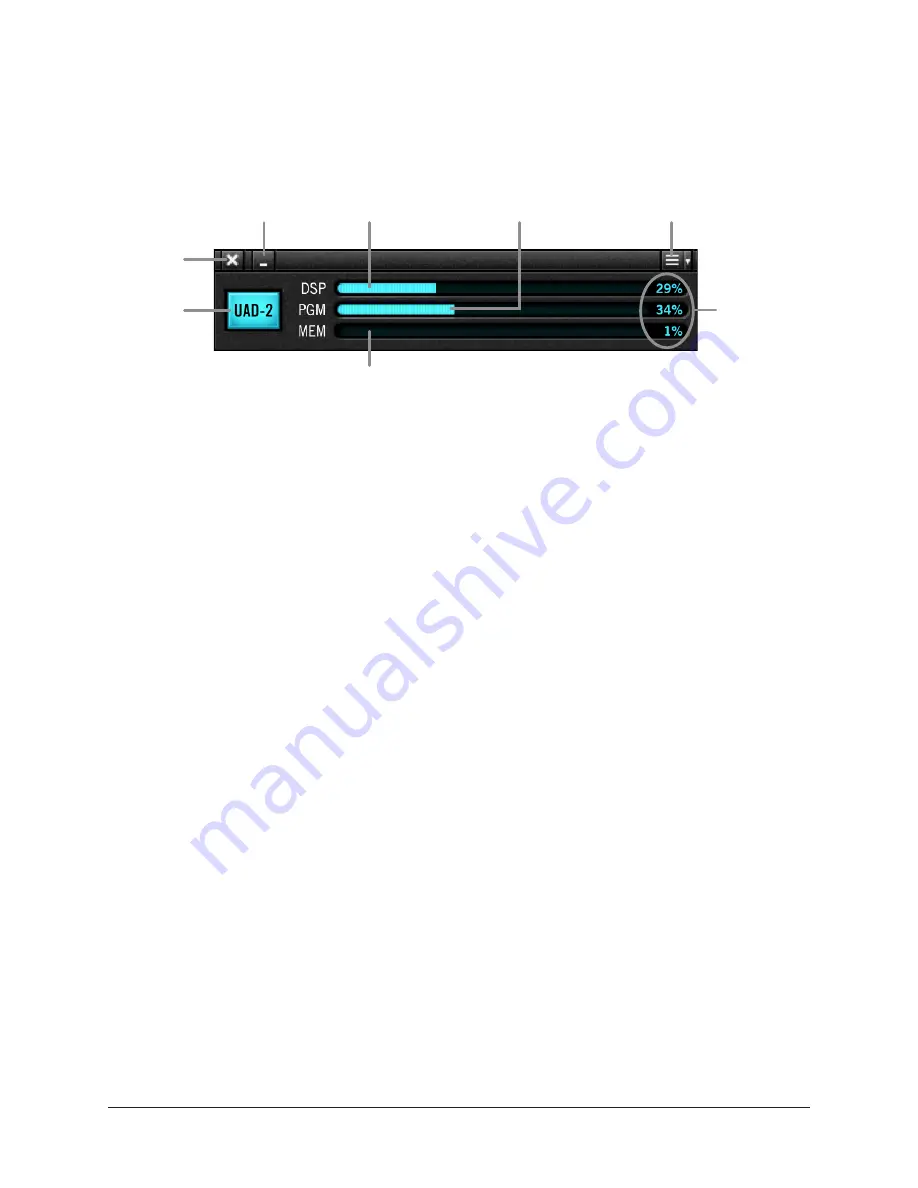
Refer to the illustration below for descriptions in this section.
UAD Meter window elements
Title Bar
The Title Bar (the strip across the top of the UAD Meter window) contains buttons to
quit the UAD Meter & Control panel application, minimize the UAD Meter window to the
macOS Dock, and access the Meter Menu to open the UAD control panels.
Open Plug-Ins Panel Button
Clicking the blue “UAD‑2” button opens the Plug‑Ins panel. It has the same function as
selecting “Plug‑Ins...” from the Meter Menu.
UAD Resource Meters
UAD plug‑in loads are shown in the UAD Meter window. These three gauges (DSP, PGM,
and MEM) provide visual feedback, helping to determine which UAD plug‑ins to use if
available UAD resources are limited.
The UAD resources are displayed as blue bar graphs and as percentages. These gauges
have no controls; they are visual indicators only.
Tip: The UAD resource gauges are also displayed within the Live Rack application.
Averaged Loads
The load for each gauge represents the average for all UAD devices in use. For example,
if one UAD‑2 Live Rack is installed, the UAD DSP load is an average of the four SHARC
DSP processors. If additional UAD‑2 Live Rack units are added to the system, the
average load is automatically adjusted.
Individual Loads
When additional UAD‑2 Live Rack units are added to the system, individual DSP loads
within the individual units can be viewed in the System Information panel.
Quit
Minimize
Program Memory Meter
Meter Menu
DSP Load Meter
Averaged
Loads
Memory Meter
Open
Plug-Ins
Panel


