Sequence Graphing
360
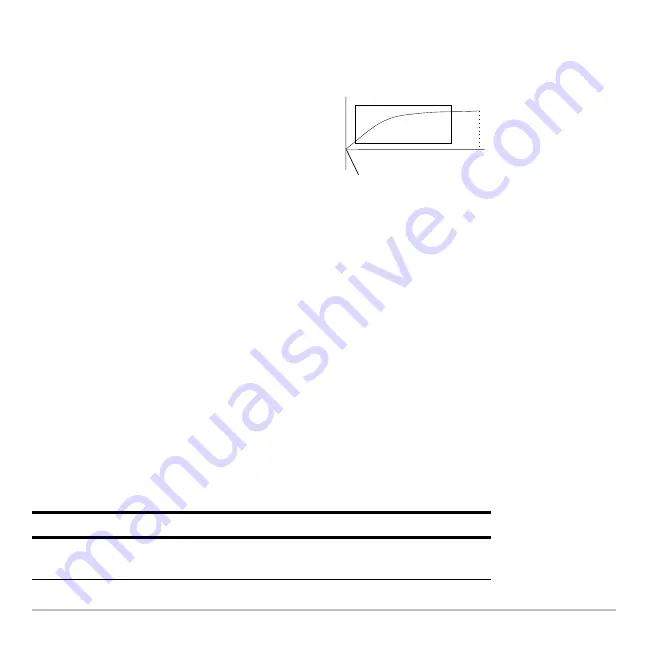
With TIME axes (from Axes on the Y= Editor), you can set
plotstrt = 1
and still graph only
a selected part of the sequence. Simply define a viewing window that shows only the
area of the coordinate plane you want to view.
Changing the Graph Format
Changing the Graph Format
Changing the Graph Format
Changing the Graph Format
The Graph Order format is not available.
•
With TIME or CUSTOM axes, multiple sequences are always plotted simultaneously.
•
With WEB axes, multiple sequences are always plotted sequentially.
Exploring a Graph
Exploring a Graph
Exploring a Graph
Exploring a Graph
As in function graphing, you can explore a graph by using the following tools. Any
displayed coordinates are shown in rectangular or polar form as set in the graph format.
You could set:
•
xmin
= first n value to graph
•
xmax
=
nmax
(although you can use other
values)
•
ymin
and
ymax
= expected values for the
sequence
Tool
For Sequence Graphs:
Free-Moving
Cursor
Works just as it does for function graphs.
plotStrt=
nma
Содержание Voyage 200
Страница 36: ...Getting Started 36 D B D B Press Result ...
Страница 45: ...Getting Started 45 3 0 D B D D B D Press Result ...
Страница 46: ...Getting Started 46 D 2 0 0 2 D B Scroll down to October and press Press Result ...
Страница 60: ...Getting Started 60 B D Press Result ...
Страница 139: ...Previews 139 8 Complete the operation Press 2 d Steps and keystrokes Display 5 f 2 ...
Страница 181: ...Operating the Calculator 181 From the Keyboard From the Keyboard From the Keyboard From the Keyboard ...
Страница 453: ...Differential Equation Graphing 453 ...
Страница 468: ...Tables 468 ...
Страница 515: ...Split Screens 515 Note Both Top Bottom and Left Right splits use the same methods to select an application ...
Страница 777: ...Activities 777 ...


