TI-83 Plus
Tables
209
Displaying the Table
The Table
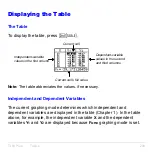
To display the table, press
y
0
.
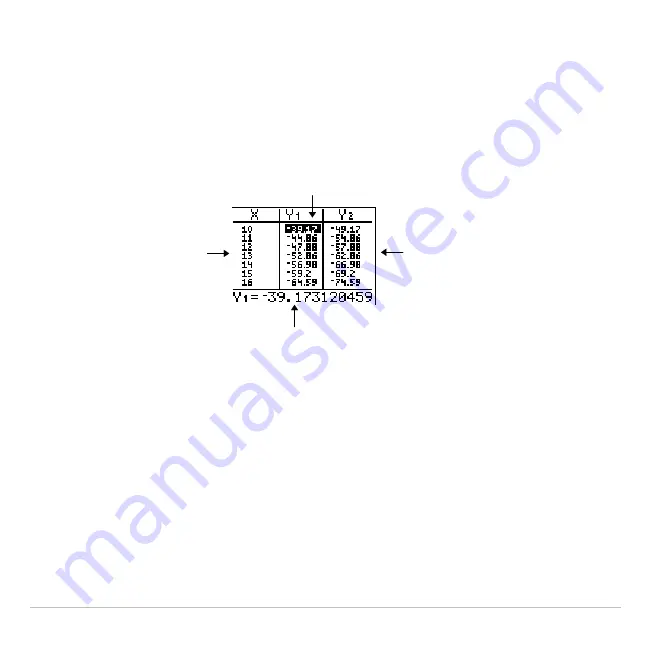
Current cell
Independent-variable
values in the first column
Dependent-variable
values in the second
and third columns
Current cell’s full value
Note: The table abbreviates the values, if necessary.
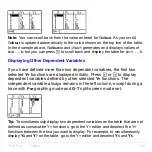
Independent and Dependent Variables
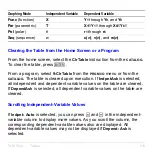
The current graphing mode determines which independent and
dependent variables are displayed in the table (Chapter 1). In the table
above, for example, the independent variable
X
and the dependent
variables
Y
1
and
Y
2
are displayed because
Func
graphing mode is set.
Содержание 83PL/CLM/1L1/V - 83 Plus Calc
Страница 228: ...TI 83 Plus Draw Instructions 225 DrawInv expression Note You cannot use a list in expression to draw a family of curves...
Страница 293: ...TI 83 Plus Lists 290 Using Lists in Graphing You can use lists to graph a family of curves Chapter 3...
Страница 407: ...TI 83 Plus Inferential Statistics and Distributions 404 Input Calculated results Drawn results...
Страница 412: ...TI 83 Plus Inferential Statistics and Distributions 409 Data Stats Input Calculated results...
Страница 446: ...TI 83 Plus Applications 443 3 Press to place the cursor on the prompt 4 Press to solve for the annual interest rate...
Страница 454: ...TI 83 Plus Applications 451 tvm_FV tvm_FV computes the future value tvm_FV PV PMT P Y C Y...

