


TI-83 Plus
Statistics
322
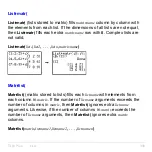
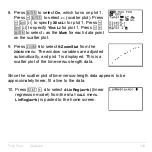
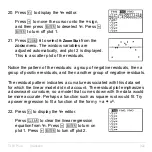
20. Press
o
to display the
Y=
editor.
Press
|
to move the cursor onto the = sign,
and then press
Í
to deselect
Y
1
. Press
}
Í
to turn off plot 1.
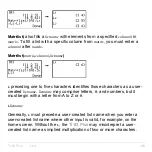
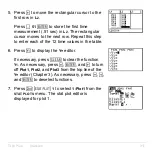
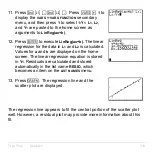
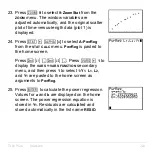
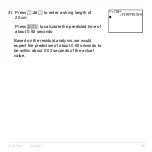
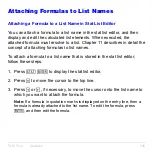
21. Press
q
9
to select
9:ZoomStat
from the
ZOOM
menu. The window variables are
adjusted automatically, and plot 2 is displayed.
This is a scatter plot of the residuals.
Notice the pattern of the residuals: a group of negative residuals, then a
group of positive residuals, and then another group of negative residuals.
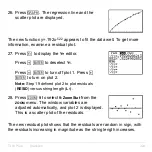
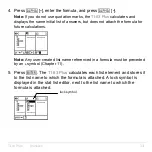
The residual pattern indicates a curvature associated with this data set
for which the linear model did not account. The residual plot emphasizes
a downward curvature, so a model that curves down with the data would
be more accurate. Perhaps a function such as square root would fit. Try
a power regression to fit a function of the form y = a
ä
x
b
.
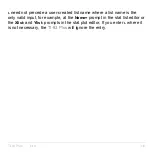
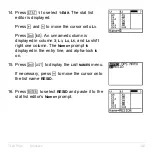
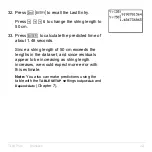
22. Press
o
to display the
Y=
editor.
Press
‘
to clear the linear regression
equation from
Y
1
. Press
}
Í
to turn on
plot 1. Press
~
Í
to turn off plot 2.
Содержание 83PL/CLM/1L1/V - 83 Plus Calc
Страница 228: ...TI 83 Plus Draw Instructions 225 DrawInv expression Note You cannot use a list in expression to draw a family of curves...
Страница 293: ...TI 83 Plus Lists 290 Using Lists in Graphing You can use lists to graph a family of curves Chapter 3...
Страница 407: ...TI 83 Plus Inferential Statistics and Distributions 404 Input Calculated results Drawn results...
Страница 412: ...TI 83 Plus Inferential Statistics and Distributions 409 Data Stats Input Calculated results...
Страница 446: ...TI 83 Plus Applications 443 3 Press to place the cursor on the prompt 4 Press to solve for the annual interest rate...
Страница 454: ...TI 83 Plus Applications 451 tvm_FV tvm_FV computes the future value tvm_FV PV PMT P Y C Y...


