TI-83 Plus
Function Graphing
106
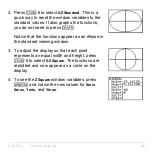
2. Press
q
6
to select
6:ZStandard
. This is a
quick way to reset the window variables to the
standard values. It also graphs the functions;
you do not need to press
s
.
Notice that the functions appear as an ellipse in
the standard viewing window.
3. To adjust the display so that each pixel
represents an equal width and height, press
q
5
to select
5:ZSquare
. The functions are
replotted and now appear as a circle on the
display.
4. To see the
ZSquare
window variables, press
p
and notice the new values for
Xmin
,
Xmax
,
Ymin
, and
Ymax
.
Содержание 83PL/CLM/1L1/V - 83 Plus Calc
Страница 228: ...TI 83 Plus Draw Instructions 225 DrawInv expression Note You cannot use a list in expression to draw a family of curves...
Страница 293: ...TI 83 Plus Lists 290 Using Lists in Graphing You can use lists to graph a family of curves Chapter 3...
Страница 407: ...TI 83 Plus Inferential Statistics and Distributions 404 Input Calculated results Drawn results...
Страница 412: ...TI 83 Plus Inferential Statistics and Distributions 409 Data Stats Input Calculated results...
Страница 446: ...TI 83 Plus Applications 443 3 Press to place the cursor on the prompt 4 Press to solve for the annual interest rate...
Страница 454: ...TI 83 Plus Applications 451 tvm_FV tvm_FV computes the future value tvm_FV PV PMT P Y C Y...

