TI-83 Plus
Activities
548
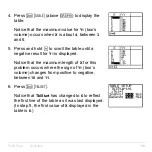
4. Press
y
0
(above
s
) to display the
table.
Notice that the maximum value for
Y
1
(box’s
volume) occurs when
X
is about
4
, between
3
and
5
.
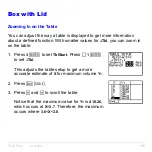
5. Press and hold
†
to scroll the table until a
negative result for
Y
1
is displayed.
Notice that the maximum length of
X
for this
problem occurs where the sign of
Y
1
(box’s
volume) changes from positive to negative,
between
10
and
11
.
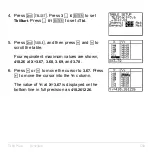
6. Press
y
-
.
Notice that
TblStart
has changed to
6
to reflect
the first line of the table as it was last displayed.
(In step 5, the first value of
X
displayed in the
table is
6
.)
Содержание 83PL/CLM/1L1/V - 83 Plus Calc
Страница 228: ...TI 83 Plus Draw Instructions 225 DrawInv expression Note You cannot use a list in expression to draw a family of curves...
Страница 293: ...TI 83 Plus Lists 290 Using Lists in Graphing You can use lists to graph a family of curves Chapter 3...
Страница 407: ...TI 83 Plus Inferential Statistics and Distributions 404 Input Calculated results Drawn results...
Страница 412: ...TI 83 Plus Inferential Statistics and Distributions 409 Data Stats Input Calculated results...
Страница 446: ...TI 83 Plus Applications 443 3 Press to place the cursor on the prompt 4 Press to solve for the annual interest rate...
Страница 454: ...TI 83 Plus Applications 451 tvm_FV tvm_FV computes the future value tvm_FV PV PMT P Y C Y...

