TI-83 Plus
Function Graphing
141
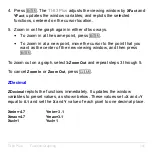
4. Press
Í
. The
TI-83 Plus
adjusts the viewing window by
XFact
and
YFact
; updates the window variables; and replots the selected
functions, centered on the cursor location.
5. Zoom in on the graph again in either of two ways.
•
To zoom in at the same point, press
Í
.
•
To zoom in at a new point, move the cursor to the point that you
want as the center of the new viewing window, and then press
Í
.
To zoom out on a graph, select
3:Zoom Out
and repeat steps 3 through 5.
To cancel
Zoom In
or
Zoom Out
, press
‘
.
ZDecimal
ZDecimal
replots the functions immediately. It updates the window
variables to preset values, as shown below. These values set
@
X
and
@
Y
equal to
0.1
and set the
X
and
Y
value of each pixel to one decimal place.
Xmin=
L
4.7
Ymin=
L
3.1
Xmax=4.7
Ymax=3.1
Xscl=1
Yscl=1
Содержание 83PL/CLM/1L1/V - 83 Plus Calc
Страница 228: ...TI 83 Plus Draw Instructions 225 DrawInv expression Note You cannot use a list in expression to draw a family of curves...
Страница 293: ...TI 83 Plus Lists 290 Using Lists in Graphing You can use lists to graph a family of curves Chapter 3...
Страница 407: ...TI 83 Plus Inferential Statistics and Distributions 404 Input Calculated results Drawn results...
Страница 412: ...TI 83 Plus Inferential Statistics and Distributions 409 Data Stats Input Calculated results...
Страница 446: ...TI 83 Plus Applications 443 3 Press to place the cursor on the prompt 4 Press to solve for the annual interest rate...
Страница 454: ...TI 83 Plus Applications 451 tvm_FV tvm_FV computes the future value tvm_FV PV PMT P Y C Y...

