
TI-83 Plus
Activities
567
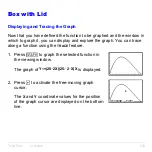
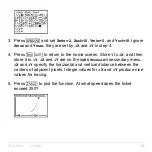
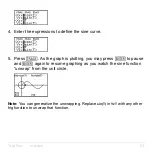
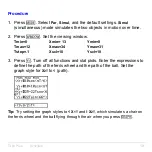
4. Press
q
6
to graph the inequality in the standard window.
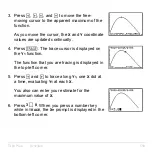
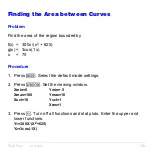
5. Press
r
†
†
to move to
Y
6
. Then press
|
and
~
to trace the
inequality, observing the value of
Y
.
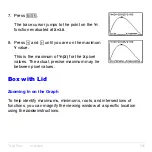
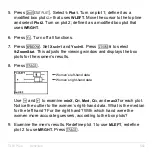
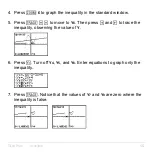
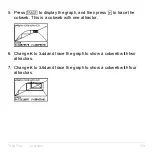
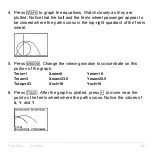
6. Press
o
. Turn off
Y
4
,
Y
5
, and
Y
6
. Enter equations to graph only the
inequality.
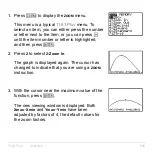
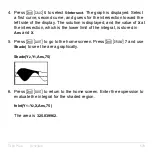
7. Press
r
. Notice that the values of
Y
7
and
Y
8
are zero where the
inequality is false.
Содержание 83PL/CLM/1L1/V - 83 Plus Calc
Страница 228: ...TI 83 Plus Draw Instructions 225 DrawInv expression Note You cannot use a list in expression to draw a family of curves...
Страница 293: ...TI 83 Plus Lists 290 Using Lists in Graphing You can use lists to graph a family of curves Chapter 3...
Страница 407: ...TI 83 Plus Inferential Statistics and Distributions 404 Input Calculated results Drawn results...
Страница 412: ...TI 83 Plus Inferential Statistics and Distributions 409 Data Stats Input Calculated results...
Страница 446: ...TI 83 Plus Applications 443 3 Press to place the cursor on the prompt 4 Press to solve for the annual interest rate...
Страница 454: ...TI 83 Plus Applications 451 tvm_FV tvm_FV computes the future value tvm_FV PV PMT P Y C Y...