TI-83 Plus
Statistics
321
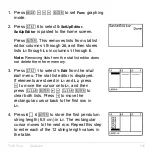
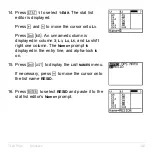
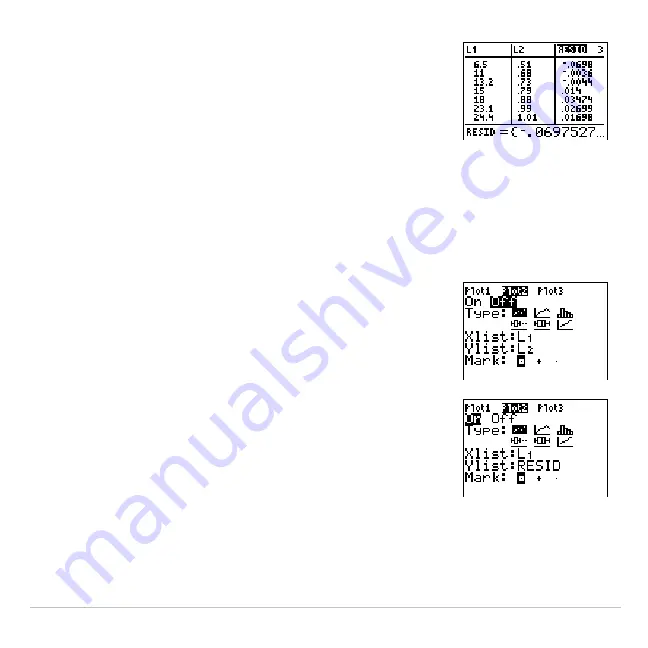
17. Press
Í
.
RESID
is stored in column
3
of the
stat list editor.
Press
†
repeatedly to examine the residuals.
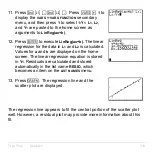
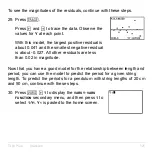
Notice that the first three residuals are negative. They correspond to the
shortest pendulum string lengths in
L
1
. The next five residuals are
positive, and three of the last four are negative. The latter correspond to
the longer string lengths in
L
1
. Plotting the residuals will show this pattern
more clearly.
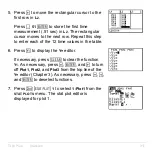
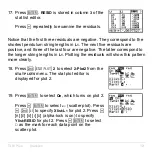
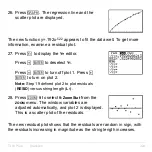
18. Press
y
,
2
to select
2:Plot2
from the
STAT PLOTS
menu. The stat plot editor is
displayed for plot 2.
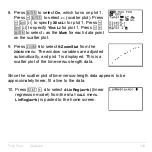
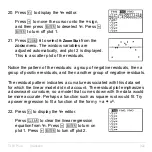
19. Press
Í
to select
On
, which turns on plot 2.
Press
†
Í
to select
"
(scatter plot). Press
†
y
d
to specify
Xlist:L
1
for plot 2. Press
†
[
R
] [
E
] [
S
] [
I
] [
D
] (alpha-lock is on) to specify
Ylist:RESID
for plot 2. Press
†
Í
to select
›
as the mark for each data point on the
scatter plot.
Содержание 83PL/CLM/1L1/V - 83 Plus Calc
Страница 228: ...TI 83 Plus Draw Instructions 225 DrawInv expression Note You cannot use a list in expression to draw a family of curves...
Страница 293: ...TI 83 Plus Lists 290 Using Lists in Graphing You can use lists to graph a family of curves Chapter 3...
Страница 407: ...TI 83 Plus Inferential Statistics and Distributions 404 Input Calculated results Drawn results...
Страница 412: ...TI 83 Plus Inferential Statistics and Distributions 409 Data Stats Input Calculated results...
Страница 446: ...TI 83 Plus Applications 443 3 Press to place the cursor on the prompt 4 Press to solve for the annual interest rate...
Страница 454: ...TI 83 Plus Applications 451 tvm_FV tvm_FV computes the future value tvm_FV PV PMT P Y C Y...

