Common Analysis and Display Functions
R&S
®
FSVA3000/ R&S
®
FSV3000
460
User Manual 1178.8520.02 ─ 01
When is a peak a peak? - Peak excursion
During a peak search, for example when a marker peak table is displayed, noise val-
ues may be detected as a peak if the signal is very flat or does not contain many
peaks. Therefore, you can define a relative threshold ( "Peak Excursion" ). The signal
level must increase by the threshold value before falling again before a peak is detec-
ted. To avoid identifying noise peaks as maxima or minima, enter a peak excursion
value that is higher than the difference between the highest and the lowest value mea-
sured for the displayed inherent noise.
Effect of peak excursion settings (example)
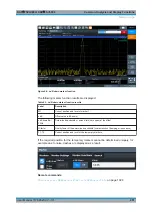
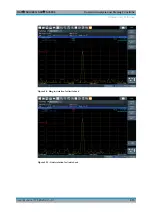
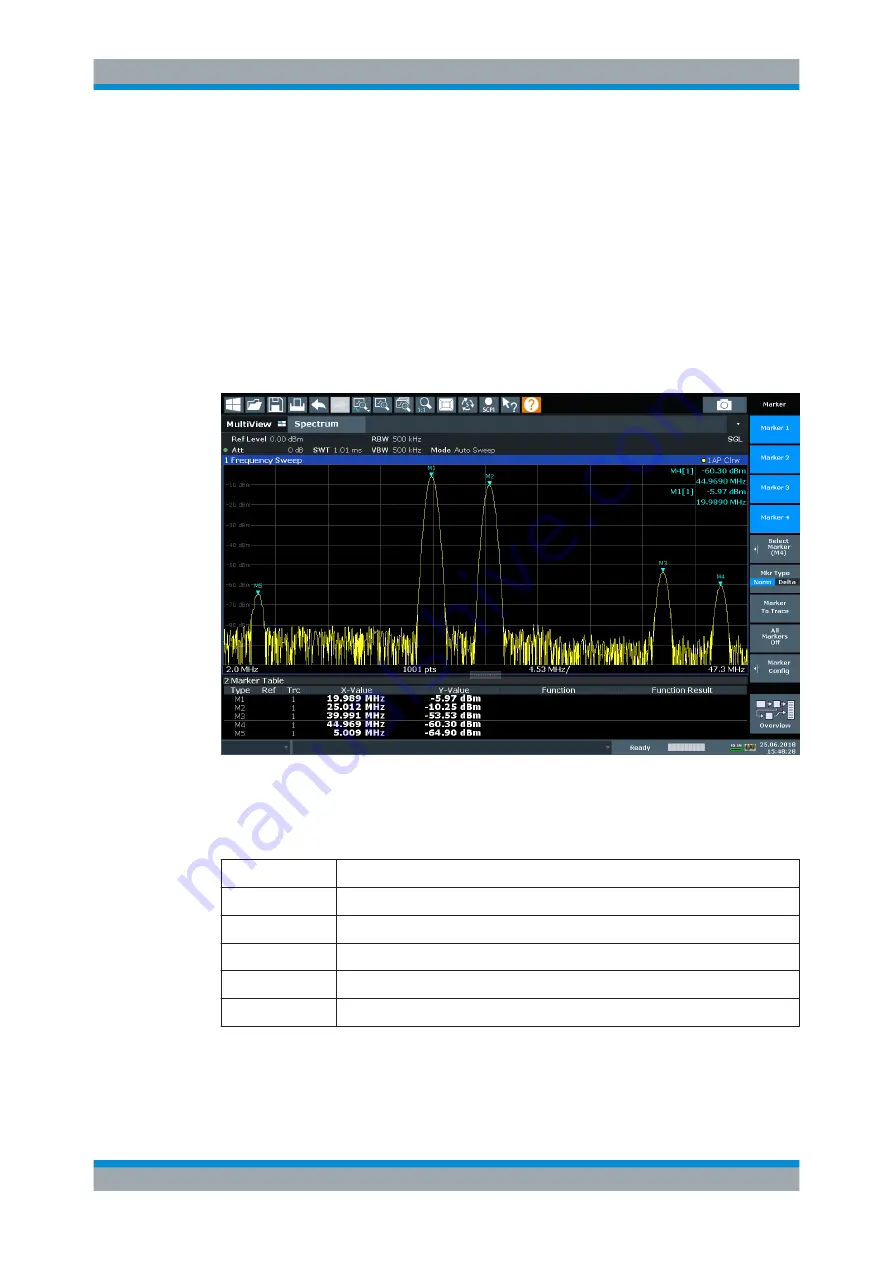
The following figure shows a trace to be analyzed.
Figure 9-6: Trace example
The following table lists the peaks as indicated by the marker numbers in the diagram
above, as well as the minimum decrease in amplitude to either side of the peak:
Marker #
Min. amplitude decrease to either side of the signal
1
80 dB
2
80 dB
3
55 dB
4
39 dB
5
32 dB
In order to eliminate the smaller peaks M3, M4 and M5 in the example above, a peak
excursion of at least 60
dB is required. In this case, the amplitude must rise at least
60
dB before falling again before a peak is detected.
Marker Usage

