Common Analysis and Display Functions
R&S
®
FSVA3000/ R&S
®
FSV3000
471
User Manual 1178.8520.02 ─ 01
●
The frequencies/times for each data point must be defined in ascending order;
however, for any single frequency or time, two data points may be entered (to
define a vertical segment of a limit line).
●
Gaps in frequency or time are not allowed. If gaps are desired, two separate limit
lines must be defined and then both enabled.
●
The entered frequencies or times need not necessarily be selectable in
R&S
FSV/A. A limit line may also exceed the specified frequency or time range.
The minimum frequency for a data point is -200 GHz, the maximum frequency is
200 GHz. For the time range representation, negative times may also be entered.
The allowed range is -1000 s to +1000 s.
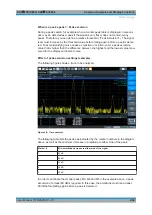
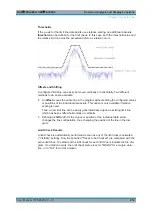
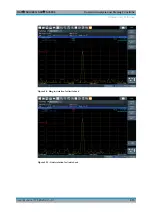
Figure 9-8: Example for an upper limit line
Limits and Margins
Limit lines define strict values that must not be exceeded by the measured signal. A
margin
is similar to a limit, but less strict and it still belongs to the valid data range. It
can be used as a warning that the limit is almost reached. The margin is not indicated
by a separate line in the display, but if it is violated, a warning is displayed. Margins are
defined as lines with a fixed distance to the limit line.
To check the signal for maximum levels you must define an
upper limit
, whereas to
check the signal for minimum levels you must define a
lower limit
.
Limits can be defined relative to the reference level, the beginning of the time scale, or
the center frequency, or as absolute values.
Relative scaling is suitable, for example, if masks for bursts are to be defined in zero
span, or if masks for modulated signals are required in the frequency domain.
Display and Limit Lines

