


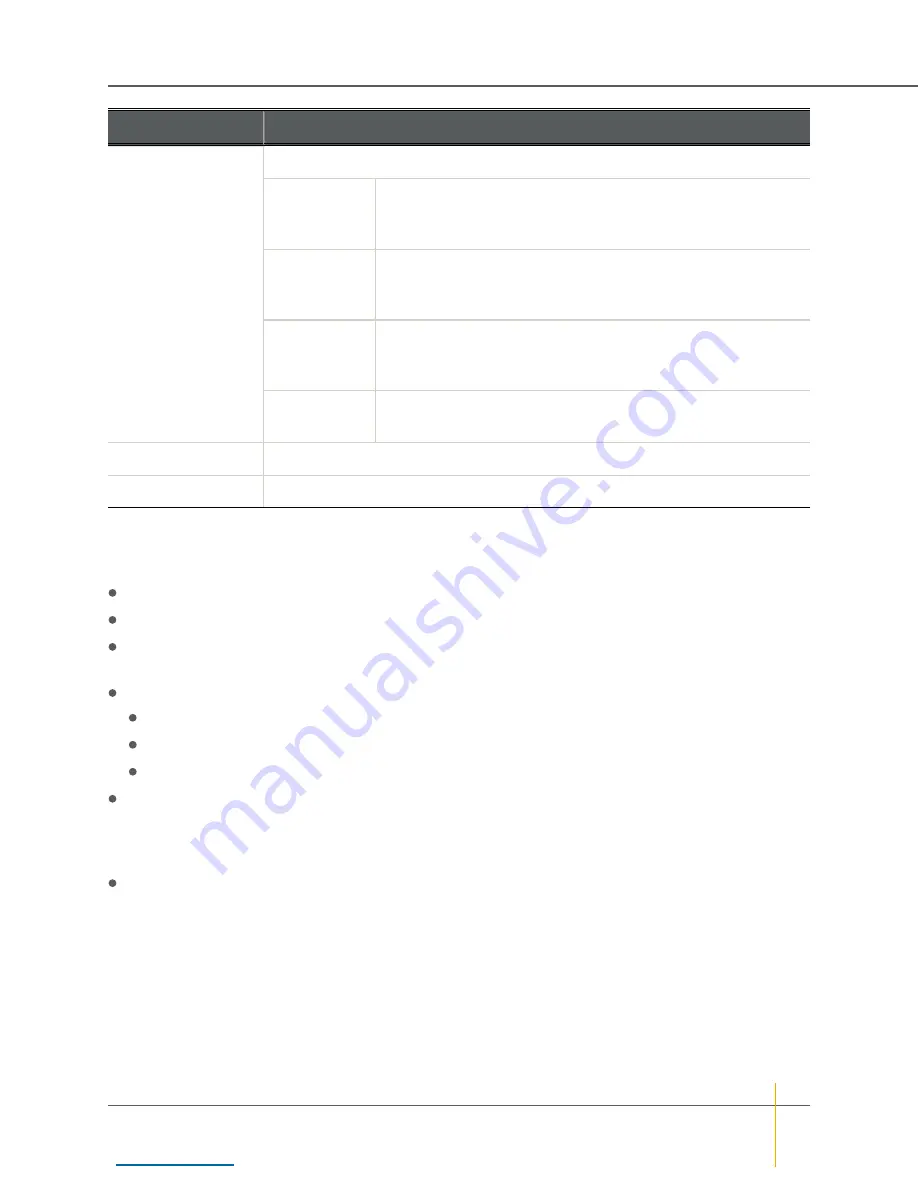
Item
Contents
Event type
The broad category that the event falls into:
Error (
E
)
Serious problems that likely require user intervention. Examples
include a failed disk, a RAID Controller going offline, or a fan
problem.
Warning (
W
)
Problems that may indicate an imminent failure, but are
themselves unlikely to compromise data. Examples include
excessive temperature, firmware errors, or disk block failures.
Information (
I
)
Events that indicate items of interest to the user. Examples
include RAID array creation or deletion, verification scan start
and stop, or a new disk being inserted.
System (
S
)
Lower-level information events. Examples include port status, IP
address changes, or RAID array initialization messages.
Port number
For events that pertain to a particular port, the number of the port
Event description
A brief description of the event
Filtering and formatting the Event Log
The event log can be filtered and formatted using the controls under
Display Options
:
Filter by Controller
: Show events for
Controller 0
,
Controller 1
, or both RAID Controllers.
Filter by Date
: Show events from the last day, week, or month; or show all entries.
Filter by Importance
: Show only error events (
E
); errors and warnings (
E
&
W
); errors, warnings, and
information events (
E
,
W
,
I
); or all events (
E
,
W
,
I
,
S
).
Date Format
: Show dates in one of three formats:
dd-mmm-yyyy at hh:mm:ss
(international format, the default)
dd/mm/yyyy hh:mm:ss
(European format)
mm/dd/yyyy hh:mm:ss
(North American format)
Show event icons
: Display icons for each event category at the beginning of each event entry. Icons are
color coded: pink for system events, blue for information events, yellow for warnings, and red for errors.
This option is deselected by default. If
Show event icons
is selected, the event type is not displayed after
the event date.
Show controller colours
: Display events for Controller 0 in black and events for Controller 1 in blue. This
option is selected by default.
Viewing Only Errors
Clicking the
Error Log
link on the
Event Log
page displays only the error events (
E
) in the log.
Downloading Event Log Files
You can download the Event Log in text format by clicking the
Download log/config dump as text
link. You
can download them as an HTML file by clicking the
HTML
link in parentheses next to it.
Chapter 2: Common Tasks — Working with the Event Log
Nexsan High-Density Storage
User Guide
50