Power and Voltage Quality Trainer
AD 2
– MI 3399
161
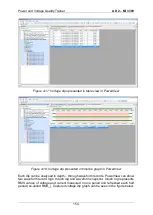
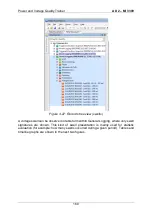
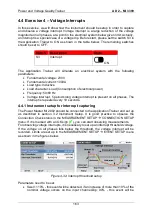
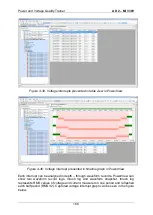
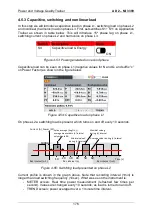
Figure 4-28: Voltage swells presented in table view in PowerView
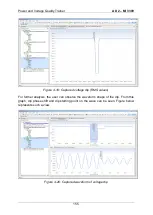
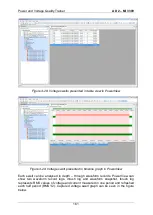
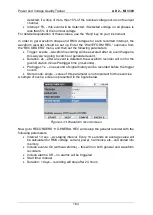
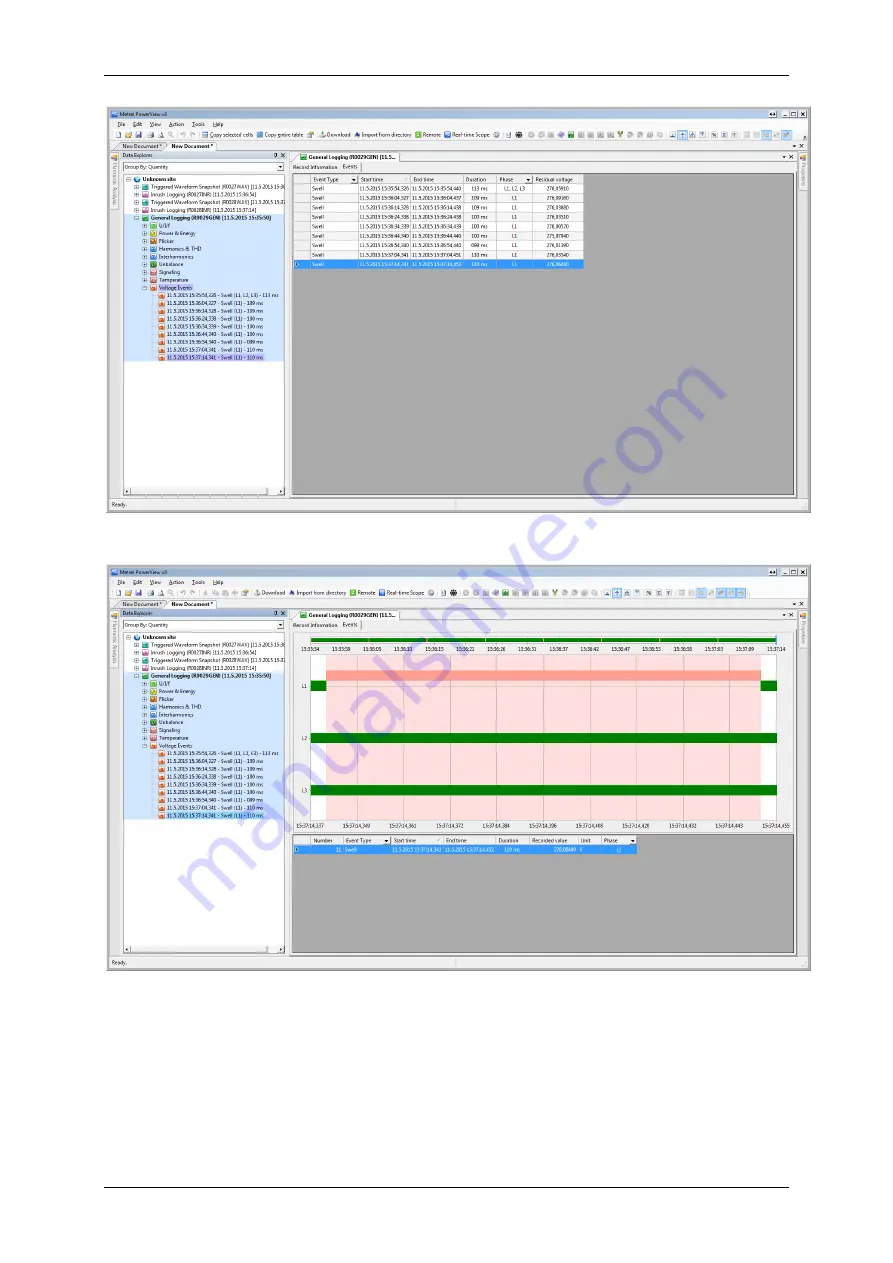
Figure 4-29: Voltage swell presented in timeline graph in PowerView
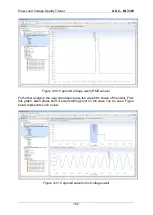
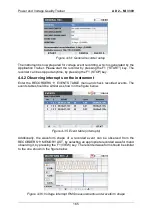
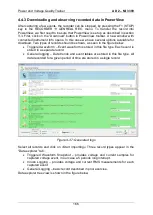
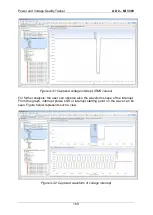
Each swell can be analysed in depth
– through waveform records. PowerView can
show two waveform record logs. Inrush log and waveform snapshot. Inrush log
represents RMS values of voltage and current measured in one period and refreshed
each half period (RMS1/2). Captured voltage swell graph can be seen in the figure
below.
Содержание MI 3399
Страница 27: ...Electrical Installation Safety Trainer AD 1 MI 3399 27...
Страница 28: ...Electrical Installation Safety Trainer AD 1 MI 3399 28 AD 1 MI 3399 EIS Electrical Installation Safety Trainer...
Страница 46: ...Electrical Installation Safety Trainer AD 1 MI 3399 46 3 Exit settings...
Страница 74: ...Electrical Installation Safety Trainer AD 1 MI 3399 74...
Страница 122: ...Power and Voltage Quality Trainer AD 2 MI 3399 122 AD 2 MI 3399 PQA Power and Voltage Quality Trainer...
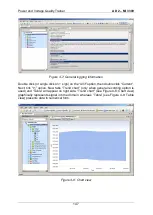
Страница 197: ...Power and Voltage Quality Trainer AD 2 MI 3399 197 Figure 4 89 Transient Chart view...
Страница 204: ...PAT Appliances Machines Safety Trainer AD 3 MI 3399 204...
Страница 205: ...PAT Appliances Machines Safety Trainer AD 3 MI 3399 205 AD 3 MI 3399 PAT Appliances Machines Safety Trainer...
Страница 249: ...PV Photovoltaic Systems Trainer AD 4 MI 3399 249...
Страница 250: ...PV Photovoltaic Systems Trainer AD 4 MI 3399 250 AD 4 MI 3399 PV Photovoltaic Systems Trainer...

