6 | Function description
The display and switch row top right
6.14 The display and switch row top right
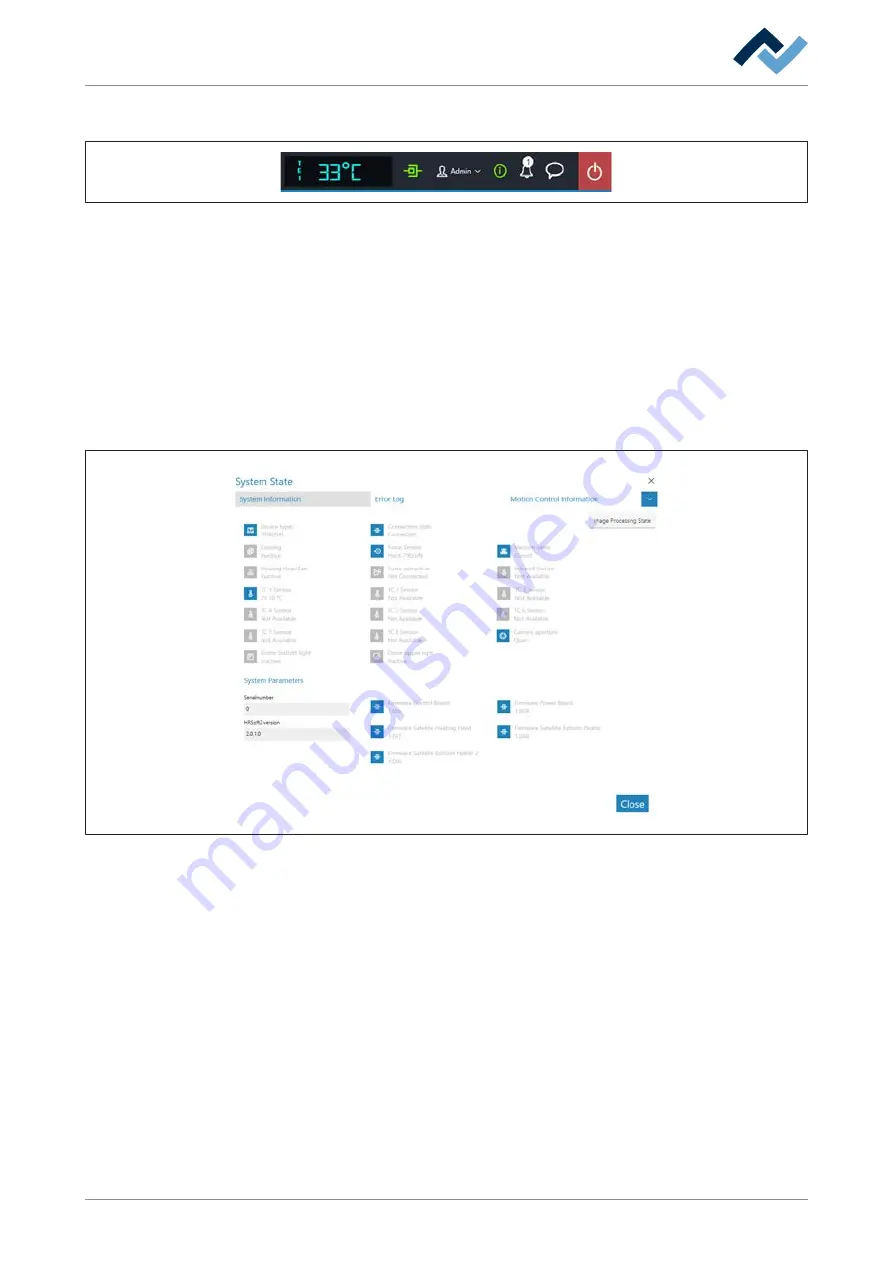
The displays and switches from left to right:
– In lower case and to the far left, the name of the selected temperature sensor.
Next to it the current temperature measured by it.
– Icon for displaying the network connection between PC and rework system.
Green = Network connection established
– Button “User name:” To call up the [Login] input dialog to change the user.
With regard to this, please read Chapter The [user management] tabulator.
– i-button to call up the [System state] dialog: If there are error messages, the
number in the circle will indicate the number of new error messages. If the but-
ton is clicked, the [System state] dialog will open which will show extensive
status information about the various Rework System components.
Fig. 19:
Starting page of the "System Status" filed, example in English
The starting page of the information page [System state] shows three buttons [Sys-
tem information], [Error log] and [Motion control information], as well as, on the
right, the arrow button [Image processing state].
a) Click on the buttons and the arrow button in the top field to see the overview
of the corresponding area.
ð
The parameters displayed in blue are currently active. Depending on the para-
meter, additional information will be displayed. The parameters displayed in
grey are currently inactive.
Range [System information]
– At the top: Display of the statuses of the basic Rework System components.
– Below [System Parameters]: Current levels of the installed HRSoft 2 version
and firmware
Ersa GmbH
Operating_instructions HR 500 DE 3BA00246-01 | Rev. 1
94 / 124
Содержание HR 500
Страница 2: ......
Страница 6: ......
Страница 20: ...2 Technical data PC system requirements Ersa GmbH Operating_instructions HR 500 DE 3BA00246 01 Rev 1 20 124 ...


