20
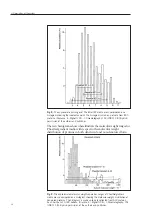
Fig. 8.
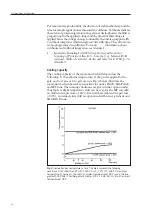
The approximate pH ranges of PhastGel IEF media are superimposed on a
histogram showing the isoelectric point. The histogram is made up of data from 800
proteins. (Gianazza, E., Righetti, P.G., J. Chromatography 193 (1980) 1-8.) By kind
permission of the authors and publisher.
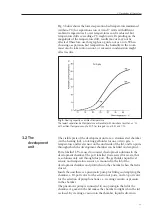
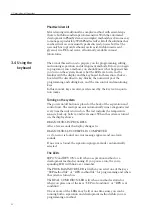
The two histograms shown here illustrate the molecular weight ranges for
PhastGel gradient media with respect to the molecular weight
distribution of proteins in both denatured and non-denatured form.
Fig. 9.
The approximate molecular weight separation ranges of PhastGel gradient
media are superimposed on a histogram showing the molecular weight distribution of
denatured proteins. The histogram is made up to data collected from 530 proteins.
Each bar spans 10,000 daltons. (Gianzza, E., Righetti, P.G., J. Chromatography, 193
(1980) 1-8). By kind permission of the authors and publisher.
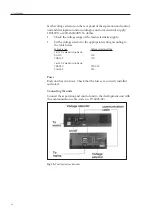
3. Description of the system
Содержание PhastSystem
Страница 1: ...Phast System user manual automated electrophoresis um 80 1320 15 Edition AI ...
Страница 2: ......
Страница 8: ...8 ...
Страница 30: ...30 ...
Страница 34: ...34 ...
Страница 64: ...64 ...
Страница 96: ...12 ...
Страница 104: ......
Страница 105: ......
Страница 106: ...PRINTED IN SWEDEN BY TK I UPPSALA AB 2003 ...

