Copyright 2020 Baker Hughes Company. All rights reserved.
Page 206 of 277
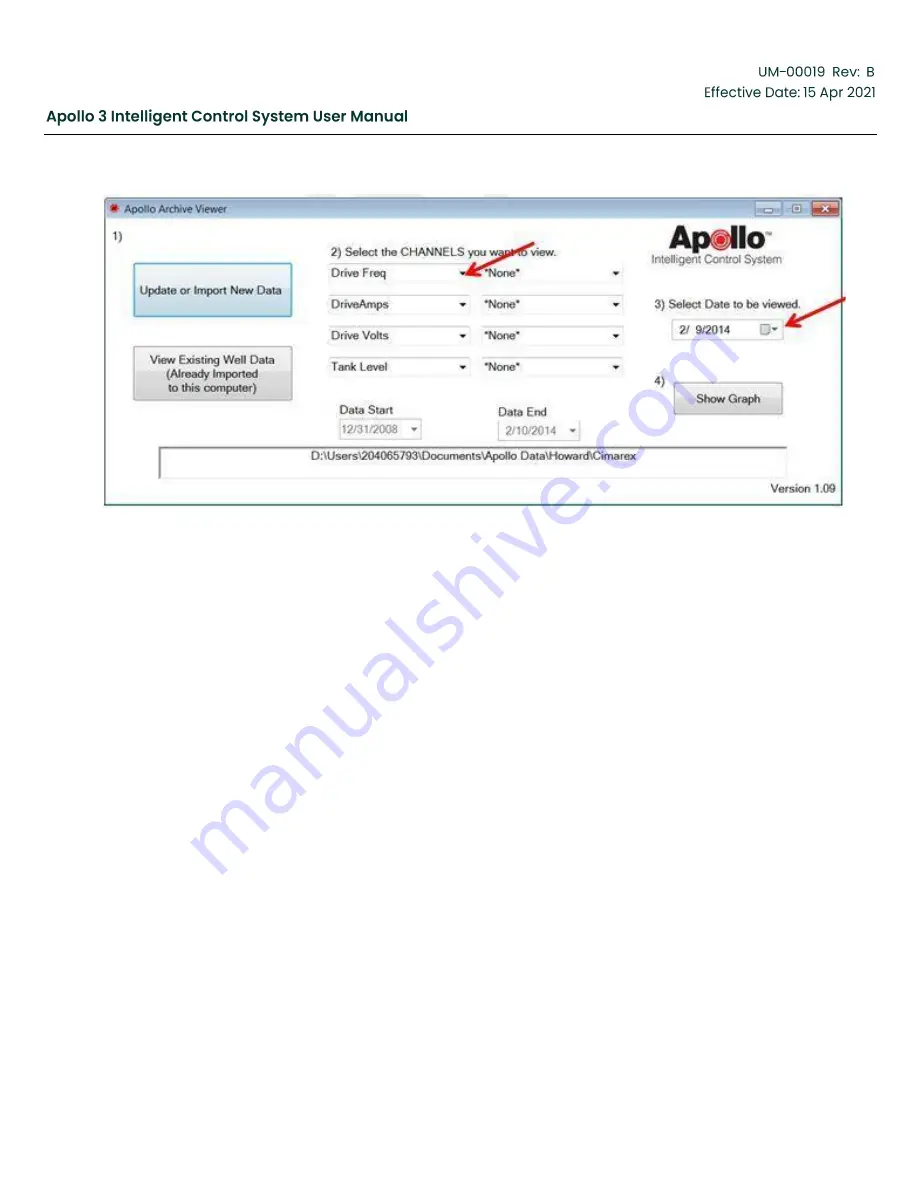
Figure 183: Import Data-Screen 3
7.4
Displaying the Archive Data
1. Click on the channel labels to bring up a channel menu to change the vertical scaling.
2. Color-coded vertical scales for each channel.
3.
“Write Text File” writes a spread-sheet type text file (.csv) of the historical data currently shown on
the graph.
4. Event drop-down window allows you to choose
“No Events”, “Faults” or “All Events”.
5. Click on the ARROW buttons to move forward and backwards in time. Double Arrows move a full
page while the Single Arrows move one division.
6. Click
on the “+” button to “zoom-in” or the “-“ button to “zoom-out”.
7. Chart Size drop-down allows you to choose the amount of time shown on the horizontal scale. This
can also be accomplished with the zoom buttons.
8. Clicking anywhere on the graph draws a vertical line, prints the time/date and numeric high and low
values for all channels at that point in time.
9. Click on Maximize to increase the size of the graph.
10. Close the graph screen to exit or change the channels you want to view.
Содержание Apollo 3
Страница 1: ...Copyright 2020 Baker Hughes Company All rights reserved Page 1 of 277...
Страница 46: ...Copyright 2020 Baker Hughes Company All rights reserved Page 46 of 277 Figure 20 Backspin Probes Drawing 2...
Страница 139: ...Copyright 2020 Baker Hughes Company All rights reserved Page 139 of 277 Figure 116 Murphy Switch Trigger Example 1...
Страница 266: ...Copyright 2020 Baker Hughes Company All rights reserved Page 266 of 277 Figure 227 USB Menu...
Страница 267: ......
Страница 276: ......
Страница 277: ...Index 129112 28 197705 28 197349 28 800638 28 197350 28 810280 28 197351 29...


