24
Subject to change without notice
PEAK-TO-PEAK
In this mode the voltage difference between the minimum and
maximum values of the displayed signal will be measured.
PEAK +
In this mode the positive peak value of the displayed signal will
be measured.
PEAK –
In this mode the negative peak value of the displayed signal
will be measured.
PERIOD
In this mode the duration of the signal period will be measured.
The period is defi ned as the time between two identical portions
of a recurring signal.
FREQUENCY
In this mode the signal frequency will be measured as the
reciprocal of the period. Only the fi rst period will be used. The
measurement pertains only to the selected channel.
RISE TIME
In this mode the rise time of the fi rst displayed positive slope
will be measured. The rise time is defi ned as the time span
between 10 to 90 % of the full amplitude.
FALL TIME
In this mode the fall time of the fi rst displayed negative slope will
be measured. The fall time is defi ned as the time span between
90 to 10 % of the full amplitude.
TRIGGER FREQ
In this mode the frequency of the trigger signal as the reciprocal
of its period will be measured. The source for this measure-
ment is the actual selected trigger source. The measurement
is performed with a 6 digit hardware counter.
TRIGGER PER.
In this mode the duration of a trigger period is measured with
a hardware counter.
8.3. Quickview
measurements
The Quickview measurements are activated by pushing the key
QUICKVIEW in the ANALYZE section of the front panel. The key
will light up indicating that the scope responded. This mode
offers the following 5 parameters which are directly displayed
in the signal:
– Maximum
voltage
– Mean
voltage
– Minimum
voltage
– Rise
time
– Fall
time
4 additional parameters will be displayed in the right bottom
corner of the screen:
– Rms
value
– Period
– Frequency
– Peak-to-peak
voltage
Only one channel may be activated in the Quickview mode. If
another channel is selected by pushing its key, the previously
selected one will be deactivated. Now the parameters of the
new channel will be shown. The mode can be left by pushing
the key again; then all channels which were activated before
the key was pushed and the Quieckview mode entered, will
become active again.
9 Analysis
The HMO352x series oscilloscopes feature a variety of analysis
functions for the stored data sets which will be displayed on the
screen. For simple mathematical functions „Quick mathema-
tics“ is provided. The formula editor allows you to create more
complex functions and the linking of functions. The frequency
analysis is accessible by just pushing a key.
9.1. Quick
mathematics
Pushing the MATH key on the front panel will call a short menu,
the key will light up red. In this short menu a maximum of 2 out
of 5 predefi ned mathematical channels may be shown, it also
allows you to switch over to the Quick mathematics function.
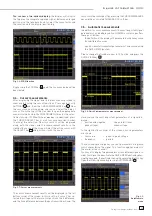
Fig. 9.1: Mathematics short menu
The predefi ned mathematical functions can be switched in by
pushing the respective soft menu keys. If a function is active,
the black dots will change to red ones. If two were activated,
the remaining ones will be shown in grey. If it is desired to just
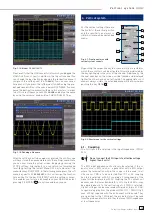
perform a simple addition or subtraction, push the key next
to the menu item „QM“ (Quick mathematics) which will open
another short menu.
Fig. 9.2: Quick mathematics menu
M e a s u r e m e n t s


