


MULTICAL®
602
122
Kamstrup
A/S
∙
Technical
Description
∙
5512
‐
931_N1_GB_11.2016
13.3.8
Application
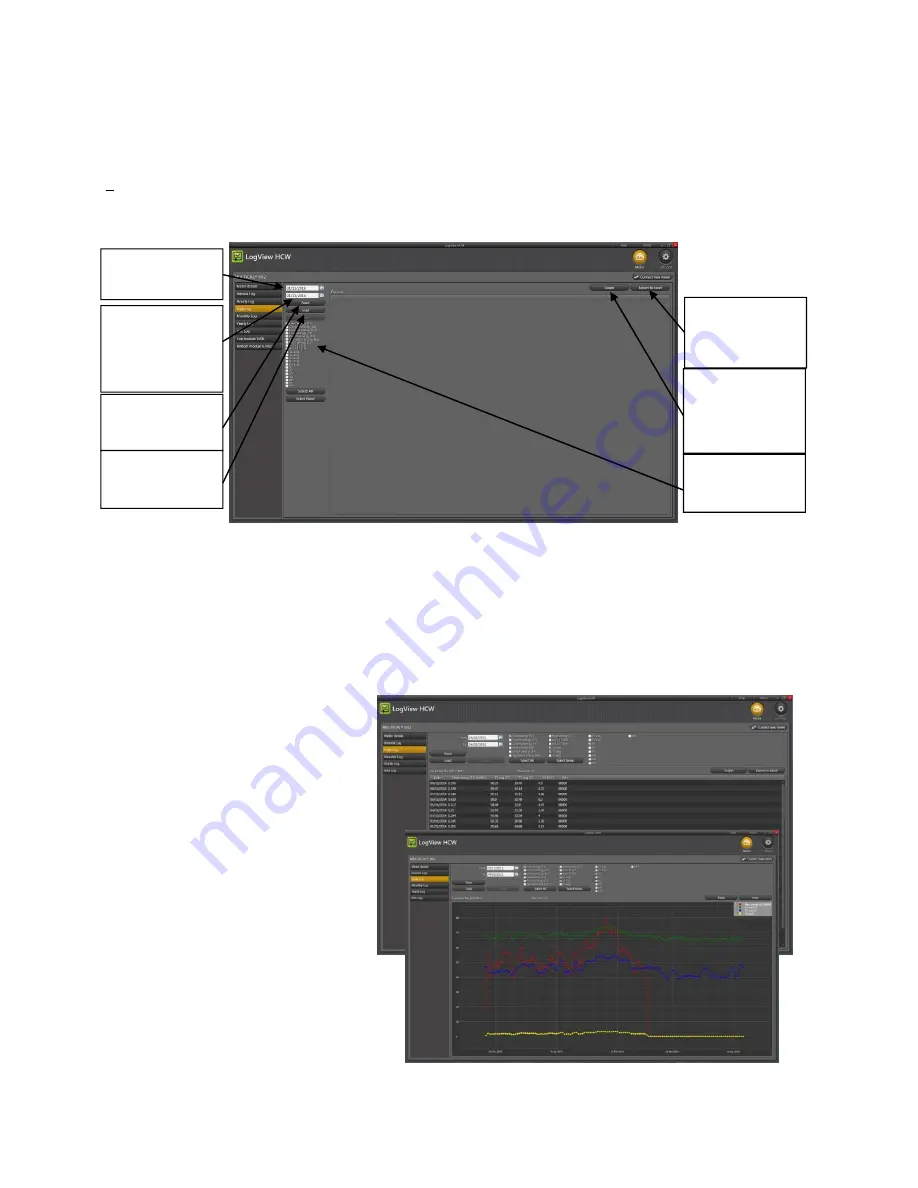
Double-click on link or icon for ”LogView HCW” in order to start the program, and select the required data function.
Meter identification!
Click “connect to meter”
”
Daily Data
” is used as an example:
Select the required registers by clicking on the box next to the register name. To read out all data, activate ”Select
All” to select all values.
When read-out has been completed the read values can be saved by clicking “Save”. We recommend to save the
read-outs, securing that data can be reopened later for further analysis or documentation.
The values appear in graphs or list form by activating ”Graph”/”Table” (toggle function).
In order to carry out a new data read-out, you just select a new period and new data registers. If the formerly read
values are not already saved you will be asked if you want to do so.
Tables can be exported direct to ”Windows
Office Excel” or printed.
To zoom in; activate
Zoom and select the
area you wish to zoom into. To zoom out;
doubleclick anywhere on the coordinate
system.
To read exact values on the graphs; deselect
Zoom and let the mouse pointer ”hover”
over the point of interest.
Choice of data
period from/to
Choice of required
data registers
Activate ”Read” to
collect required
data from the
meter
Or load already
saved data values
Choice of Graph(s)
or table presenta-
tion of data from
read/loaded
period
To save the read
values into a file
Export of read/
loaded data to
Excel spread
sheet.