2.
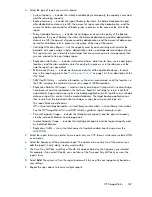
In some cases, there are more data points than the graphs can display. You must select how the
system chooses which data point to use for each time period displayed. For example, if you show
four days of data the graphs show one data point for every four-hour period. Use the Advanced
Setting list to indicate which data point out of that four-hour period is used:
• First data point — the first data point for each time period.
• Maximum data point — the data point with the highest value for each time period.
• Minimum data point — the data point with the lowest value for each time period.
3.
Select a specific virtual library to view from the list, or use “VLS Device” to include all libraries
(Logical Capacity tab only).
4.
Select
Update Graphs
. The graphs update to reflect the data options you chose.
NOTE:
The final graph displays the history of the logical capacity for the entire VLS and does not change if
you choose to view a specific library.
Physical Capacity
This tab displays different views of the physical capacity usage for an individual library or the entire
VLS system. Physical capacity is the amount of data actually stored on the disk, while the logical
capacity is the amount of data the backup application wrote. In a deduplicated environment, the
physical capacity reported represents data after compression and deduplication; without deduplication
it represents data after compression.
To export the physical capacity CSV data, enter the number of days to include in the report and select
Export
. (See “
Exporting CSV Data
” on page 159 for more information.)
To change the information displayed in the graphs, follow
Step 1
,
Step 2
, and
Step 4
in
“
Logical Capacity
” on page 162.
The final two graphs allow you to view the physical capacity for a specific storage pool or library.
You can also change the graph type from stacked to line. Use the lists to make your selections and
then select
Update Graphs
.
SAN Health
The SAN Health tab displays information on the number and types of errors encountered on the SAN.
See
Figure 53
on page 164.
To export the CSV data, in the Export Data section of the screen enter the number of days to include
in the report and click
Export
.
When you open the SAN Health tab, the graph at the bottom of the screen displays information for
the top 16 locations from all location categories with the most errors. You can change the information
displayed in the graph:
1.
Select a location category.
2.
Select the specific locations of interest from the
Available Locations
box.
3.
Using the
>>
button, move the locations of interest into the
Selected Locations
box. These are the
locations that will display in the report. You can use the
<<
button to remove locations from the
Selected Locations
box.
4.
Select another location category and repeat steps 2 and 3.
HP StorageWorks
163
Summary of Contents for StorageWorks 12000
Page 14: ...14 ...
Page 102: ...Operation 102 ...
Page 110: ...User Interfaces 110 ...
Page 150: ...Management 150 ...
Page 168: ...Monitoring 168 ...
Page 198: ...Component Identification 198 ...
Page 222: ...Support and Other Resources 222 ...
Page 232: ...Troubleshooting 232 ...
Page 236: ...Specifications 236 ...
Page 244: ...Bulgarian Notice Czech Notice Danish Notice Dutch Notice Regulatory Compliance Notices 244 ...
Page 245: ...Estonian Notice Finnish Notice French Notice German Notice HP StorageWorks 245 ...
Page 246: ...Greek Notice Hungarian Notice Italian Notice Latvian Notice Regulatory Compliance Notices 246 ...
Page 247: ...Lithuanian Notice Polish Notice Portuguese Notice Romanian Notice HP StorageWorks 247 ...
Page 249: ...Battery Replacement Notices Dutch Battery Notice HP StorageWorks 249 ...
Page 250: ...French Battery Notice German Battery Notice Regulatory Compliance Notices 250 ...
Page 251: ...Italian Battery Notice Japanese Battery Notice HP StorageWorks 251 ...
Page 252: ...Spanish Battery Notice Regulatory Compliance Notices 252 ...


