Hioki MEMORY HiCORDER 8855 Instruction Manual Download Page 190

170

────────────────────────────────────────────────────

9.2 Setting the Waveform Area

────────────────────────────────────────────────────

NOTE

9.2 Setting the Waveform Area

To evaluate the waveforms, a evaluation area is required. Two methods are
available: one is to load the already created evaluation area and settings, and
the other is to create a new evaluation area.

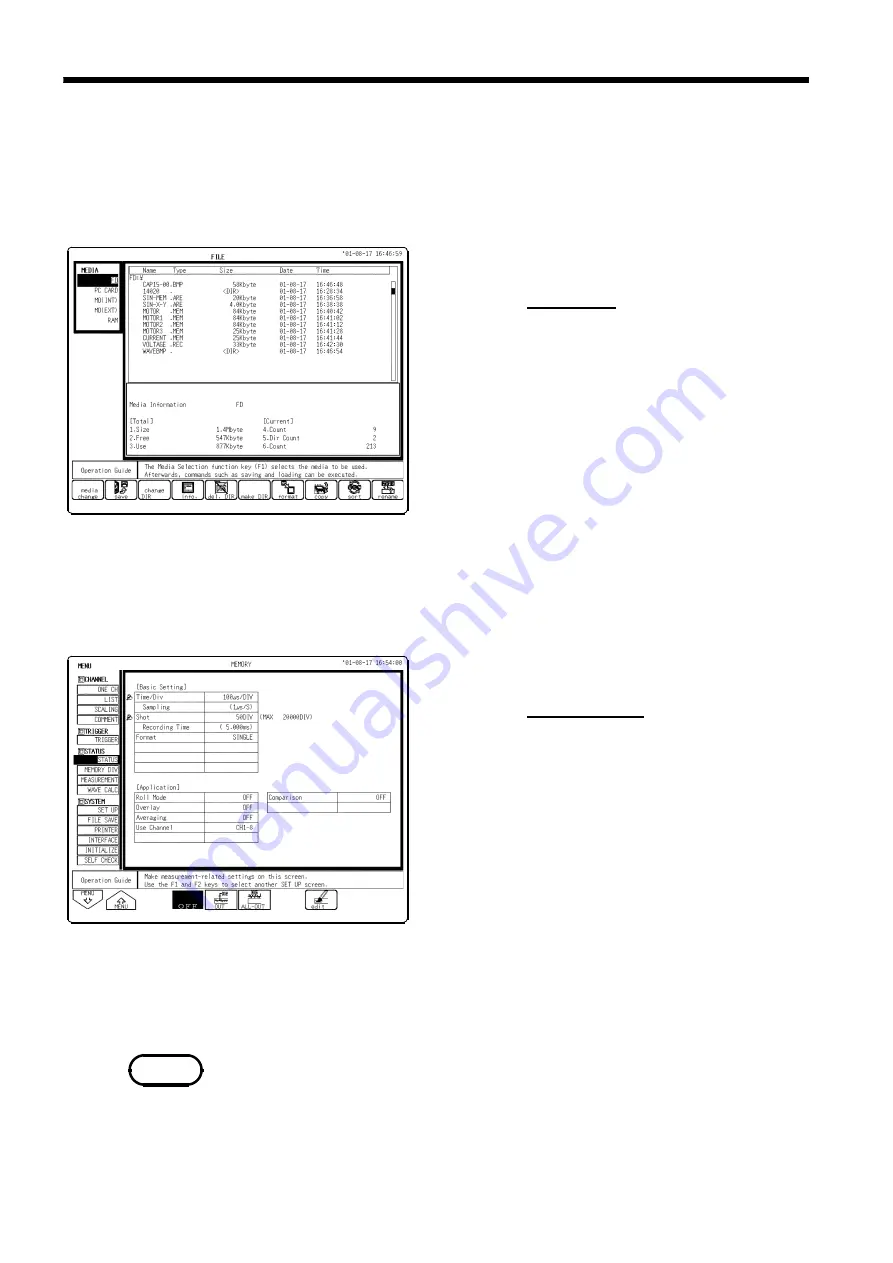
(1) Loading the already created evaluation area

Procedure 

Screen: FILE

1. Press the

FILE

key to call the File screen.

2. Select the media for loading.
3. Use the bar cursor to select the desired file.
4. Press the

F3

(

load

) key.

5. Press the

F9

(

exec.

) key.

6. When no more changes need be made to the

loaded settings, press the

DISP

key to make the

Waveform display screen appear, and then press
the

START

key to initiate measurement.

To change the settings, first change the contents,
press the

DISP

key to make the Waveform

display screen appear, and then press the

START

key to initiate measurement.
For details on load, see Quick Start Section 10.8.

(2) Creating a new evaluation area

Procedure 

Screen: STATUS

1. Press the

STATUS

key to call the Status screen.

2. Move the flashing cursor to

Comparison

.

3. Press the

F8

(

edit

) key.

4. Make the new evaluation area.

See Section 9.5.

5. Store the new evaluation area in the internal

memory.

6. After setting the parameters for "comparison"

and "stop mode," press the

DISP

key to make the

Waveform display screen appear, and then press
the

START

key to initiate measurement.

7. Save the evaluation area on the File screen, if it

is necessary. See Quick Start Section 10.7.

Only one waveform evaluation area is stored in internal memory. For
example, when operation is changed from the Memory function screen to the
X-Y screen and the X-Y screen waveform evaluation area is stored, the
waveform evaluation area created for the Memory function is lost.

Summary of Contents for MEMORY HiCORDER 8855

Page 1: ...to revision without prior notice The content of this manual is protected by copyright No reproduction duplication or modification of the content is permitted without the authorization of Hioki E E Co...

Page 2: ......

Page 3: ...l Grounding of the 8855 12 2 3 Power On Off 13 2 4 Connection of the Input Product 14 2 4 1 8950 8952 8953 10 8955 INPUT UNITs 14 2 4 2 8951 VOLTAGE CURRENT UNIT 15 2 4 3 8954 VOLTAGE TEMP UNIT 18 2 5...

Page 4: ...Setting the Auto Save Function 45 3 8 Simultaneous Display of Recorder and Memory Waveforms 47 3 9 Start and Stop Operation REC MEM 48 Chapter 4 FFT Function 49 4 1 Overview of the FFT Function 49 4...

Page 5: ...HIS 84 4 8 7 Transfer Function TRF 85 4 8 8 Cross Power Spectrum CSP 87 4 8 9 Cross Correlation CCR 89 4 8 10 Unit Impulse Response IMP 90 4 8 11 Coherence COH 91 4 8 12 Octave Analysis OCT 92 Chapte...

Page 6: ...gs 128 5 12 4 Pulse Width Measurement Settings 129 Chapter 6 Memory Segmentation Function 131 Chapter 7 Calculation Function 137 7 1 Numerical Calculation MEM 137 7 1 1 Making Settings for Numerical C...

Page 7: ...etting the STATUS Screen printout 178 10 2 1 Setting the Display Format 178 10 2 2 Setting the Waveform Display Graph Position 179 10 3 Setting the CHANNEL Screen printout 180 10 3 1 Setting the Print...

Page 8: ...2 point method Scaling Equation APPENDIX 9 Appendix 3 7 Waveform Parameter Calculation Details APPENDIX 10 Appendix 3 8 Details on Operators APPENDIX 14 Appendix 3 9 FFT Function APPENDIX 17 Appendix...

Page 9: ...read this manual first and keep it handy for future reference About This Manual This manual is the Advanced edition Instruction Manual for the 8855 MEMORY HiCORDER It describes the advanced functions...

Page 10: ...RESOLUTION UNIT 8954 VOLTAGE TEMP UNIT 8955 F V UNIT 8994 PRINTER UNIT 9646 MO UNIT with eject pin 9663 HD UNIT 9645 MEMORY BOARD 96 M words total 128 M words 9645 01 MEMORY BOARD 512 M words total 51...

Page 11: ...to 50 kHz 9272 CLAMP ON SENSOR 20 200 A 5 Hz to 10 kHz 9277 UNIVERSAL CLAMP ON CT 20 A DC to 100 kHz 9278 UNIVERSAL CLAMP ON CT 200 A DC to 100 kHz 9279 UNIVERSAL CLAMP ON CT 500 A DC to 20 kHz 9555...

Page 12: ...s AC Alternating Current Indicates DC Direct Current Indicates both DC Direct Current and AC Alternating Current Indicates the ON side of the power switch Indicates the OFF side of the power switch DA...

Page 13: ...measuring instrument i e the input value that causes the digital display to show a 1 Measurement categories Overvoltage categories This instrument complies with CAT II safety requirements To ensure sa...

Page 14: ...rt circuit occurs Connection to the primary side involves the risk of electric shock and damage to the instrument Before using the instrument make sure that the insulation on the connection cords is u...

Page 15: ...connection method to avoid this kind of result Refer to Section 2 5 Logic Probe Connection for details 1 Before connecting the logic probe to the measurement object be sure that power is supplied fro...

Page 16: ...ctrical hazard Replacing the Input Modules To avoid electric shock accident before removing or replacing an input module confirm that the instrument is turned off and that the connection cords are dis...

Page 17: ...strument be sure to remove the input modules floppy disk MO disk PC card and SCSI cable before shipping Use the original packing materials when reshipping the instrument if possible Handling the CD R...

Page 18: ...n cord 9197 9198 Using a non specified cord may result in incorrect measurements due to poor connection or other reasons Recording paper when the 8994 PRINTER UNIT is installed Use only recording pape...

Page 19: ...ntation Function Explains how to use the Memory Segmentation Function Chapter 7 Operation Function Explains how to use the Calculating Waveform Parameter value and Waveform GO NG Evaluation Chapter 8...

Page 20: ...xii Chapter Summary...

Page 21: ...1 1 2 3 4 5 6 7 8 9 10 11 12 13 14 A Chapter 1 Product Overview...

Page 22: ...it is easy to confirm waveform measurements directly on screen 3 Measurement functions Memory with a maximum sampling speed of 50 ns simultaneous recording on all channels If using the optional print...

Page 23: ...spot The printer can also be used to print screen shots reduction screen shots and parameter information Report print can be printed 14 External storage means MO HD drive option Measurements settings...

Page 24: ...4 1 2 Identification of Controls and Indicators 4 5 7 1 2 13 14 19 20 3 6 8 9 10 11 12 15 16 17 18 21 22 23 24 25 26 Front Panel 1 2 Identification of Controls and Indicators...

Page 25: ...y of the current screen display 12 FEED key Causes the printer paper to advance for as long as the key is pressed 13 CURSOR key These keys serve to move the flashing cursor in the four directions 14 S...

Page 26: ...ned for the dedicate logic probes CH A to D 8 Eject button Removes the PC card 9 External output terminal Various output signals can be selected such as the BUSY or error signals 10 NG evaluation outp...

Page 27: ...ese slots accept input modules 21 Fastening screw Secures the plug in instrument 22 Analog input connector Unbalanced analog input on ANALOG UNIT 23 Blowing slot Upper Panel Left Side Panel 2 3 1 2 Bo...

Page 28: ...8 1 2 Identification of Controls and Indicators...

Page 29: ...Installation of the Product 1 2 3 4 5 6 7 8 9 10 11 12 13 14 A Chapter 2 Installation and Preparation 2 1 Installation of the Product Installation orientation Install the instrument on a flat level su...

Page 30: ...not to block the ventilation openings and assure proper ventilation When using the instrument in an upright position take care not to block the openings on both side Avoid the following locations Subj...

Page 31: ...t do not use devices that have a voltage frequency outside the specified range or that output square waves 1 Voltage 100 V to 240 V AC 2 Power frequency 50 60 Hz 3 Sine wave output Do not use devices...

Page 32: ...y and Ground Connections 2 2 2 Functional Grounding of the 8855 Functional grounding terminal When the 8855 is used in noise prone environments connect the functional grounding terminal to improve noi...

Page 33: ...ection 2 2 The instrument is properly grounded NOTE 2 3 Power On Off After the power switch is turned on wait approximately 30 min to stabilize the inside temperature of the connected input module in...

Page 34: ...eed the 9328 POWER CORD To avoid injuries or damage to this instrument do not connect any device other than the 9322 to the terminal NOTE 9197 500 V Items that can be hooked to with large alligator cl...

Page 35: ...using the 3274 and the 3275 CLAMP ON PROBE When conductors being measured carry in excess of the safe voltage level SELV E and not more than 600 V CAT II or 300 V CAT III to prevent short circuits an...

Page 36: ...t 1 Align the BNC connector with the guide groove of the 8855 input connector and turn clockwise while pressing in to lock the connector For using the 8951 use the 9198 CONNECTION CORD 2 To remove fro...

Page 37: ...r locks into place 2 Align the groove on the conversion cable connector with the adapted clamp on sensor plug and push inward until the connector locks into place 3 To unplug the cables slide the lock...

Page 38: ...hermocouple is installed in a location within the safe super low voltage 30 V rms or 60 V DC For information on selecting a thermocouple when measuring high voltage components contact the thermocouple...

Page 39: ...emove the covering from the thermocouple To install and remove the thermocouple use a tool such as a screwdriver The push button terminal block on the 8954 VOLTAGE TEMP UNIT is for use with a thermoco...

Page 40: ...the measurement object connect the ground of the measurement object to the 8855 ground terminal Also in this case power should be supplied from the same source Refer to Section 2 2 Power Supply and G...

Page 41: ...nt measures input voltage so although current can not be measured directly current can be measured by the voltage output from the HIOKI 9810 10 9132 10 CLAMP ON PROBEs Connect the BNC connector of the...

Page 42: ...V DC CAT ll 600 V AC or DC CAT lll Attempting to measure voltage in excess of the maximum rating could destroy the instrument and result in personal injury or death H L Grabber clips H L 2 000 V DC 1...

Page 43: ...00 Vpeak 1MHz max for the 9666 100 1PROBE The measurement category overvoltage category is the same as that of the input modules of MEMORY HiCORDERs that use the 9665 and the 9666 Do not measure volta...

Page 44: ...g Recording Paper when the 8994 PRINTER UNIT is installed 1 Press the stock cover and open it 2 Put down the head up down lever 3 Insert the attachments into the ends of the roll of recording paper an...

Page 45: ...paper you pulled out of the printer with the edges of the recording paper set into the holder If the edges of the recording paper are not aligned exactly the paper will come out crooked when printing...

Page 46: ...thermally sensitive be aware of the following points To avoid paper discoloration do not expose it to direct sunlight Store at no more than 40 and 90 RH For permanent storage of important recorded da...

Page 47: ...breaker Connection to the primary side involves the risk of electric shock and damage to the instrument Before using the instrument make sure that the insulation on the connection cords is undamaged a...

Page 48: ...t after removing an input module install a blank panel over the opening of the removed module CAUTION When making measurements on an AC power line for example using a voltage transformer be sure to co...

Page 49: ...rms or 60 V DC L H L 30 V rms or 60 V DC 30 V rms or 60 V DC 30 V rms or 60 V DC BNC 30 V rms or 60 V DC 8855 GND 8954 370 V AC DC 370 V AC DC H L 30 V rms or 60 V DC 30 V rms or 60 V DC 8855 GND 895...

Page 50: ...inal Ground Input 8950 8855 GND PT Input Ground 8950 H L When making measurements on an AC power line for example using a voltage transformer be sure to connect the voltage transformer ground terminal...

Page 51: ...h DIV recorder 17 steps 10 s DIV to 5 min DIV memory 20 steps 5 Time axis resolution 100 points DIV 6 Storage capacity 32 M words DIV 10000 Recorder 20000 Memory 128 M words DIV 40000 Recorder 80000...

Page 52: ...the length of the data sample for a single measurement Display function Select the waveform data recorder memory on the waveform display screen Display format Select the format type for the waveform...

Page 53: ...ing function See Section 5 3 Comment function See Section 5 4 Vernier function See Section 5 6 3 Trigger mode Trigger source Pre trigger Trigger selection Processing measurement data Printing the meas...

Page 54: ...to access the STATUS screen This section explains how to set the STATUS screen of the recorder and memory function See the corresponding sections for items that can be set in the Waveform display or C...

Page 55: ...ure Screen STATUS CHANNEL Waveform display TRIGGER SYSTEM 1 Use the Menu keys to display the desired screen 2 Move the flashing cursor to the top position 3 Select the REC MEM function key display Rec...

Page 56: ...rder is set by the memory Screen STATUS Procedure 1 1 Use the Menu keys to display the desired screen 2 Move the flashing cursor to the Time Div item 3 Move the flashing cursor to the time axis range...

Page 57: ...he Shot item 3 To set the recording length move the flashing cursor to either Recorder or Memory according to which is to be set and select SELECT 4 Use the Jog control or the function keys to make a...

Page 58: ...he STATUS key to display the STATUS screen 2 Move the flashing cursor to the Function item 3 Use the function keys to make a setting The type of display waveform can be set by pressing the REC MEM fun...

Page 59: ...Procedure Screen STATUS 1 Press the STATUS key to display the Status screen 2 Move the flashing cursor to the Format item as shown in the figure on the left 3 Use the function keys to select the displ...

Page 60: ...l recording is enabled 3 4 Setting the Additional Recording Function This records regarding the memory as though it were recording paper As waveforms captured by the recorder are stored in the instrum...

Page 61: ...nts to delimit them The line of data is vertical When using the 8953 10 HIGH RESOLUTION UNIT 8954 VOLTAGE TEMP UNIT or 8955 F V UNIT and its additional recording function is active if logic input is a...

Page 62: ...ntire change can be promptly apprehended 6 Recording Length SELECT 30 DIV to continuous REC 30 DIV to 20000 DIV MEM ARBITRARY 1 DIV to 10000 DIV REC 1 DIV to 20000 DIV MEM Using channels 8 ch Capacity...

Page 63: ...be set Procedure Screen PRINTER 1 Setting the printer format 1 Press the SYSTEM key to display the PRINTER screen 2 Move the flashing cursor to the Print Mode item 3 Use the function keys to make a se...

Page 64: ...function keys to make a setting When the recorder s time axis is set to 200 ms DIV or faster the real time printing settings are automatically disabled Further when the time axis range is set to a spe...

Page 65: ...een STATUS 1 Press the SYSTEM key to display the STATUS screen 2 Move the flashing cursor to the Auto Save item 3 Use the function keys select the media for auto saving 4 Move the flashing cursor to t...

Page 66: ...th auto save since numbers are attached to the end of file names long file names are truncated when this number is appended to the end of the file name When automatic storage is selected for both reco...

Page 67: ...top represent the number of times data is loaded into memory blocks and the related trigger positions Waveform scroll When the blinking cursor is on the time axis or zoom for the memory waveform at th...

Page 68: ...trigger point data collection begins at that time When automatic storage is enabled and measurement is interrupted in progress measurement data taken prior to the interruption point is stored automat...

Page 69: ...correlation function histogram transfer function cross power spectrum cross correlation function unit impulse response coherence function octave analysis 5 Analysis modes 1 channel FFT 2 channel FFT 6...

Page 70: ...ata or memory waveform data for the FFT analysis FFT analysis mode FFT analysis mode Analysis channel X and Y axis display Display scale Averaging Set the averaging type and count Interpolation Select...

Page 71: ...o adjustment Low pass filter Settings the advanced function Comment function See Section 5 4 Trigger mode Trigger source Pre trigger Trigger selection Processing measurement data Printing the measurem...

Page 72: ...ee Sections 4 3 STATUS Settings FFT Press the STATUS key to access the STATUS screen This section explains how to set the STATUS screen of the FFT function See the corresponding sections for items tha...

Page 73: ...desired screen 2 Move the flashing cursor to the top position 3 Select the FFT function key display This setting determines whether only one channel 1ch FFT or two channels 2ch FFT are used for FFT pr...

Page 74: ...2 1 67 m 10 min 1 min 333 m 2 0 83 m 20 min 2 min 133 m 2 0 33 m 50 min 5 min The frequency range frequency axis maximum value can be set as follows The frequency range corresponds to the time axis ra...

Page 75: ...umber of Points values of 2000 5000 and 10 000 correspond to multiples of 1 2 1 5 and 1 10 respectively 4 FFT Number of Points values of 2000 5000 and 10 000 correspond to multiples of 2 5 and 10 resp...

Page 76: ...ut signal that will be processed Window processing can be used to minimize leakage error Screen STATUS Waveform display Procedure 1 Use the Menu keys to display the desired screen 2 Move the flashing...

Page 77: ...is available only when the Format is set to Single or Dual display Screen STATUS Procedure 1 Press the STATUS key to display the screen to be displayed 2 Move the flashing cursor to the Peak item 3 U...

Page 78: ...morized Recorder Memory waveform that has been stored in memory The starting point for calculation can be specified using the cursor on the screen with the stored Recorder Memory waveform displayed If...

Page 79: ...of the data for the FFT calculation result on the X axis and the imaginary number portion of the data on the Y axis NOTE You can set the format for displaying input signal waveforms on the screen and...

Page 80: ...keys to display the desired screen 2 Move the flashing cursor to the Averaging item 3 Use the function keys to make a setting 4 Move the flashing cursor to the Number item and set the time of averagi...

Page 81: ...relation function Linear z z z Unit impulse response Linear z z z Coherence function Linear z z z Octave analysis LIN MAG LOG MAG z z z z z z Frequency axis peak hold The specified number of samples a...

Page 82: ...performed FFT processing is performed on the frequency axis and the calculated result is averaged 2 Trigger occurs when the trigger conditions are fulfilled again 3 When the specified number of data h...

Page 83: ...e result will be meaningless Frequency axis waveform 1 After the START key was pressed data are captured whenever the trigger conditions are fulfilled and averaging is carried out until the specified...

Page 84: ...or NG fail evaluation of the input signal waveform can be performed using an evaluation area specified by the user This can serve to detect irregular waveforms After the evaluation result is generated...

Page 85: ...oss correlation function Power spectrum Impulse response Auto correlation function Coherence function Histogram Octave analysis Used to select the FFT calculation method Procedure Screen STATUS Wavefo...

Page 86: ...S Waveform display 1 Use the Menu keys to display the desired screen 2 Move the flashing cursor to the w1 or w2 item 3 Use the function keys or Jog shuttle control select the channel The values for tr...

Page 87: ...tave 1 1 octave Flashing cursor Set the X and Y axis for display of FFT calculation results Different units can be selected for the X and Y axis With some FFT analysis modes one of the axis cannot be...

Page 88: ...N MAG LOG MAG PHASE PSP Power Spectrum LIN Hz LOG Hz LIN MAG LOG MAG ACR Auto Correlation Function Time Linear HIS Histogram Volt Linear TRF Transfer Function LIN Hz LOG Hz LIN REAL LIN IMAG LIN MAG L...

Page 89: ...window Waveform will be displayed in selected color Waveform will not be displayed Set the waveform display ON OFF and the waveform color Procedure Screen STATUS Waveform display 1 Use the Menu keys...

Page 90: ...function keys to edit each value NOTE The display scale for showing the FFT processing result can either be set manually or automatically Procedure Screen STATUS 1 Press the STATUS key to display the...

Page 91: ...ave sharp filter characteristics NOTE When octave analysis has been selected two different filter types can be chosen The characteristics of both filter types are within ANSI CLASS 3 tolerance limits...

Page 92: ...UNICATOR is required 4 4 Printout of FFT Processing Results When 8994 PRINTER UNIT is installed Select the format waveform or numerical value should be used to output FFT processing results Procedure...

Page 93: ...MO HD device after they are captured The Auto Save function stores a file in the directory currently selected on the file screen See Quick Start Section 10 13 2 Procedure Screen STATUS 1 Press the ST...

Page 94: ...r to Quick Start Section 10 7 When both auto print and auto save are enabled auto save takes precedence For details on connected SCSI device refer to Quick Start Section 10 4 The directory and the num...

Page 95: ...waveform color 7 Analysis mode Select from 12 items Selects the FFT analysis method See Section 4 8 8 Analysis channel Select from channel 1 to using channels Selects the channel for FFT analysis 9 X...

Page 96: ...this interval data recording starts regardless of trigger state Displays Storing When the printer is enabled the recording waveform is printed at the same time it is displayed When the STOP key is pre...

Page 97: ...n waveform of the input signal fa Time Time axis display Indicates the value of the specified TIME DIV frequency range Refer to the table Frequency Range Frequency Resolution Window Width Correspondin...

Page 98: ...m frequency range value LOG Hz Frequency spectrum display as logarithmic units The range is from between 1 400 and 1 4000 of value to the frequency range value Real Linear display of real number part...

Page 99: ...sis Function Stored waveform Y axis LIN REAL X axis LOG Hz Y axis LIN IMAG X axis LOG Hz Y axis LIN MAG X axis LOG Hz Y axis LOG MAG X axis LOG Hz Y axis PHASE X axis LOG Hz Nyquist Examples Linear sp...

Page 100: ...include Determining the peaks of waveform frequency components Determining the effective values of frequency components LIN Hz Frequency spectrum display as linear units The range is from DC to the ma...

Page 101: ...agnitude information Major applications include Determining the peaks of waveform frequency components Determining the energy levels of high and low harmonics LIN Hz Frequency spectrum display as line...

Page 102: ...nal It is obtained by taking the square root of the total of power spectra for all frequencies PSPo DC component PSPi ith AC component Compensation is applied to data for specified points captured bef...

Page 103: ...with an improvement in signal to noise ratio Checking the periodic signal components contained in a noisy waveform and periodic noise Time Time display The center indicates the reference 0 the right...

Page 104: ...ts Major applications include Determining waveform imbalance Determining whether a waveform is artificial or natural from the waveform distribution most natural waveforms are regular sine waves Pa Vol...

Page 105: ...units The range is from DC to the maximum frequency range value LOG Hz Frequency spectrum display as logarithmic units The range is from between 1 400 and 1 4000 of value to the frequency range value...

Page 106: ...rm input signal Stored waveform output signal Y axis LIN REAL X axis LOG Hz Y axis LIN IMAG X axis LOG Hz Y axis LIN MAG X axis LOG Hz Y axis LOG MAG X axis LOG Hz Y axis PHASE X axis LOG Hz Nyquist E...

Page 107: ...uency spectrum display as logarithmic units The range is from between 1 400 and 1 4000 of value to the frequency range value Real Linear display of real number part of the data as voltage Nyquist mode...

Page 108: ...Stored waveform 1 Stored waveform 2 Y axis LIN REAL X axis LOG Hz Y axis LIN IMAG X axis LOG Hz Y axis LIN MAG X axis LOG Hz Y axis LOG MAG X axis LOG Hz Y axis PHASE X axis LOG Hz Nyquist Example Cr...

Page 109: ...essed as a function of the time difference Major applications Obtaining the phase difference between two signals in time units Obtaining a speed or distance by measuring the time delay Time Time displ...

Page 110: ...A response waveform equivalent to the unit impulse function is obtained by analyzing the input and output signals of the system being measured Major applications Checking circuit time constants IMP 1...

Page 111: ...individual input lines to the output of multi input systems LIN Hz Frequency spectrum display as linear units The range is from DC to the maximum frequency range value LOG Hz Frequency spectrum displ...

Page 112: ...ave analysis divides the frequency axis evenly on a logarithmic scale and expresses the level as a bar for each band In analog octave analysis the octave band center frequencies and filter characteris...

Page 113: ...93 4 8 FFT Analysis Function Stored waveform 1 1 octave analysis 1 3 octave analysis Example Octave analysis waveforms...

Page 114: ...1 1 1 0 1 1 1 0 1 1 0 1 1 2 3 4 1 6 2 2 5 1 0 1 1 1 0 1 1 1 0 1 1 1 0 1 1 0 1 2 5 6 7 3 15 4 5 1 0 1 1 0 1 1 1 0 1 1 1 0 1 1 1 0 1 1 3 8 9 10 6 3 8 10 1 0 1 1 0 1 1 1 0 1 1 1 0 1 1 1 0 1 1 4 11 12 13...

Page 115: ...1 5 k 40 k 1 0 1 1 1 0 1 1 1 0 1 1 1 0 1 1 1 0 1 1 16 47 48 49 50 k 63 k 80 k 1 0 1 1 1 0 1 1 1 0 1 1 1 0 1 1 0 1 1 17 50 51 52 100 k 125 k 160 k 1 0 1 1 1 0 1 1 1 0 1 1 1 0 1 1 0 1 1 18 53 54 55 200...

Page 116: ...96 4 8 FFT Analysis Function...

Page 117: ...97 1 2 3 4 5 6 7 8 9 10 11 12 13 14 A Chapter 5 Input Channel Settings...

Page 118: ...k Start 6 3 10 Logic Display Position z z See Section Quick Start 6 3 10 Zero Adjustment z z See Section Quick Start 6 4 Variable Function z See Section 5 2 Scaling Function z See Section 5 3 Comment...

Page 119: ...After conversion 1 23 V min 0 eu min 5 78 V max 10 eu max The scaling function allows conversion of the voltage output by the sensor into a desired physical quantity But unless the setting is changed...

Page 120: ...riable function is disabled Variable function is enabled Procedure Screen ONE CH LIST CHANNEL 1 Press the CHAN key to display the Channel ONE CH LIST screen 2 Using the cursor key move the flashing cu...

Page 121: ...erical values that were input Performs backspaces Clears all numerical values that were set Determines the numerical values that were set and exits the numerical value input screen NOTE Setting the va...

Page 122: ...channel Two types of scaling functions are available Conversion ratio method Scaling is performed by specifying a physical quantity to correspond to a 1V input signal conversion ratio eu v an offset...

Page 123: ...n 2 Using the cursor key move the flashing cursor to the channel to be set 3 Use the function keys to make the selection Method 2 Screen CHANNEL ONE CH 1 Press the CHAN key and move to the ONE CH item...

Page 124: ...p before Initializes the system You can select from the list NOTE 2 Entering the numerical value 1 Move the flashing cursor to the item to be set 2 Use the function keys to make the selection 3 Use th...

Page 125: ...50 45 40 35 CH1 100 mV fs 5 mV x 1 CH1 50 to 50 mV Before scaling After scaling Before scaling After scaling The input channel is represented in full span mode instead of full scale mode and the unit...

Page 126: ...m of a current value Cursor values A and B respectively show the current values If the gauge is turned on before the printout is made the gauge is output in a current value The example below shows the...

Page 127: ...cording paper Enabling title comment input prints the title on recording paper for all functions SET COM prints setup conditions function time axis range magnification of time axis and trigger time al...

Page 128: ...ts the settings for each channel voltage axis range magnification of voltage axis zero position low pass filter and full span voltage range along with comments For details on display see Qick Start Ma...

Page 129: ...n NOTE The procedure for entering the characters for the comments units etc is described Procedure Screen COMMENT CHANNEL SCALING UNIT FILE SAVE NAME 1 Use the cursor key to move the flashing cursor t...

Page 130: ...ules Procedure Screen LIST SCALING COMMENT CHANNEL 1 Press the CHAN key to display the copy settings on the Channel screen List screen Scaling screen or Comments screen 2 Move the flashing cursor to t...

Page 131: ...possible to make the settings while monitoring the waveforms in real time on the Waveform display screen For details on settings refer to Section Quick Start 6 3 Setting the analog channels Waveform...

Page 132: ...channels that have been selected with the POSITION and RANGE knobs 4 You can set the low pass filter with the F4 key 5 You can turn the waveform display ON and OFF with the F5 key 6 When setting other...

Page 133: ...of 1 2 V to 1 0 V and display the converted value Procedure 1 Press the DISP key to display the Waveform display screen 2 Press the F9 CH SET key and move the flashing cursor to the channel to be set...

Page 134: ...9322 s maximum rated voltage to earth is 1500 V AC or DC CAT ll 600 V AC or DC CAT lll when using alligator clips it is 1000 V AC or DC CAT ll 600 V AC or DC CAT lll To avoid electrical shock and pos...

Page 135: ...66 100 1PROBE on the modules input terminal 1000 1 setting Select this when using the 9322 DIFFERENTIAL PROBE NOTE Procedure Screen LIST CHANNEL 1 Press the CHAN key to display the List Channel screen...

Page 136: ...ure Screen LIST ONE CH CHANNEL 1 Use the Menu keys to display the desired screen 2 Move the flashing cursor to the Mode item to be set 3 Use the function keys to select VOLTAGE For details on other co...

Page 137: ...o be set 3 Select the model name of the clamp on sensor or clamp on probe to be used with the function keys Scaling is performed automatically For details on other common settings see Quick Start Sect...

Page 138: ...L 1 Use the Menu keys to display the desired screen 2 Move the flashing cursor to the Mode item to be set 3 Use the function keys to select DC For details on other common settings see Quick Start Sect...

Page 139: ...ting the response The response time can be selected from three levels High Speed Standard or Low Speed Normally this selection is set to High Speed but if the frequency is low or fluctuations are freq...

Page 140: ...key to display the OPTION screen 2 Move the flashing cursor to the A A F item to be set 3 Use the function keys to make a setting We recommend using an input module equipped with an anti aliasing fil...

Page 141: ...ment Flashing cursor Thermocouple Measurement input range Thermocouple Measurement input range K 200 to 1350 N 200 to 1300 E 200 to 800 R 0 to 1700 J 200 to 1100 S 0 to 1700 T 200 to 400 B 300 to 1800...

Page 142: ...rformed 2 Setting reference junction compensation 1 Use the Menu keys to display the desired screen 2 Move the flashing cursor to the RJC item to be set 3 Use the function keys to make the selection 3...

Page 143: ...eeded NOTE Measurement range and measurement input upper and lower limits Note that the measurement input upper and lower limits change according to the measurement range When the following upper and...

Page 144: ...nt range Frequency 0 1 Hz to 5k Hz Rotation 10 r min to 500 r min Commercial Power Frequency Measurement 50 Hz 60 Hz Function display Meaning Move the cursor up in the selection window Move the cursor...

Page 145: ...most measurements this option is set to OFF 1 Use the Menu keys to display the desired screen 2 Move the flashing cursor to the Pull Up item to be set 3 Use the function keys to make the selection 5 S...

Page 146: ...urement results are displayed after a single cycle is verified When measuring the phenomena called rotation stoppage with hold set to ON the 8855 waits endlessly for measurement period verification so...

Page 147: ...nu keys to display the desired screen 2 Move the flashing cursor to the Range item to be set 3 Use the JOG control the function keys or the RANGE knob to make the selection 3 Setting the threshold val...

Page 148: ...ed HI level and LO pulse levels Procedure Screen LIST ONE CH CHANNEL 1 Setting the measurement mode 1 Use the Menu keys to display the desired screen 2 Move the flashing cursor to the Mode item to be...

Page 149: ...level 1 Use the Menu keys to display the desired screen 2 Move the flashing cursor to the Level item to be set 3 Use the function keys to make the selection Precautions for measuring pulse duty ratio...

Page 150: ...1 Use the Menu keys to display the desired screen 2 Move the flashing cursor to the Pull Up item to be set 3 Use the function keys to make the selection 5 Setting the level Select whether you want to...

Page 151: ...r 6 Memory Segmentation Function This function divides the memory into separate blocks each of which can be used for waveform recording The recording length DIV has priority over the number of memory...

Page 152: ...When continuous print auto print is being performed in REPEAT trigger mode Using Memory segmentation function In order to permit display and recording after the acquired data is recorded to one block...

Page 153: ...Recording length DIV Number of channel 8 4 2 0 to 655 1024 1024 1024 656 to 1310 512 1024 1024 1311 to 2621 256 512 1024 2622 to 5242 128 256 512 5243 to 10485 64 128 256 10486 to 20971 32 64 128 2097...

Page 154: ...JOG to set the number of splits See item 2 of this section for details about the number of splits that can be set 4 Start end block setting Set the beginning and end blocks when you use blocks from a...

Page 155: ...e the flashing cursor to the Ref Block item 2 Use the function keys to make the selection 3 Move the flashing cursor to the numerical value item ref block Ref block settings can be made one block at a...

Page 156: ...returns you to the start block and recording starts End of measurement When the STOP key is pressed twice during measurement the 8855 is forcibly stopped Auto printout is not executed When auto save i...

Page 157: ...erforms waveform calculation only for the data between the cursors When the calculation range is specified The following 19 types of calculations are possible 1 Average value 2 RMS value 3 Peak to pea...

Page 158: ...O connected through SCSI Stored on MO disk or hard disk Saves on devices connected through LAN This requires the 9333 LAN COMMUNICATOR Up to four numerical calculations No 1 16 can be set simultaneous...

Page 159: ...al printer Numerical calculations results can be saved in text format to the current directory selected in the File screen For the file name to be saved see Quick Start Section 10 7 Saving the Data Pr...

Page 160: ...lashing cursor 4 Make a selection from the function key display 5 Move the flashing cursor to the item you want to save to file Allows you to choose between saving each calculation result to a new fil...

Page 161: ...ea Specified level time The time from the trigger to the specified level Pulse width The pulse width of the waveform data Duty ratio The duty ratio of the waveform signal Pulse count The pulse count o...

Page 162: ...EMENT STATUS 1 Press the STATUS key to display the numerical calculation screen 2 Move the flashing cursor to the number of the calculation to be used as copy source 3 Press the F4 copy key The copy s...

Page 163: ...a can be set independently for each of the calculation sets No 1 No 16 Procedure Screen MEASUREMENT STATUS 1 Set each numerical calculation operation 2 Move the flashing cursor to COMP and use the fun...

Page 164: ...screen NG channels are represented by an x on the printout The overall evaluation result is NG even if there is only one NG channel While all evaluation results appear on the Waveform display screen...

Page 165: ...eform displays after data corresponding to recording length have been stored in memory When the STOP key is pressed twice during measurement the 8855 is forcibly stopped numerical calculation are not...

Page 166: ...the Numerical calculation screen Set the items For details see Section 7 1 1 Making Settings for Numerical Calculation Move the flashing cursor to measurement and F6 exec key measurement is displayed...

Page 167: ...ulated Move the flashing cursor to wave calculation item and select F6 exec key Calculate the existing waveform data between the A and B cursors Enter equation Delete equation Copy equation Enter the...

Page 168: ...able When the memory segmentation function or roll mode is used waveform processing is not possible When the memory split setting is turned off you can browse the last 16 waveforms but when calculatio...

Page 169: ...he area from cursor A to the end of the measurement data Sixteen processing equations Z1 Z8 can be defined Procedure Screen WAVE CALC STATUS 1 Making the processing equation 1 Press the STATUS key to...

Page 170: ...n for example four MOV operators or two MOV and two SLI operator etc The maximum number of digits for a constant is 30 If division by 0 is specified 1 0 an overflow value is output Equations are calcu...

Page 171: ...an equation number has been assigned copy source can be copied to another equation number copy target Procedure Screen WAVE CALC STATUS 1 Move the flashing cursor to one of the Z1 Z8 items 2 Select th...

Page 172: ...figure on the left 3 Use the function keys or the JOG control to make a setting Equations not to be used should be set to NONE calculation result is not recorded If the same channel is selected as sou...

Page 173: ...le display settings are made accordingly Depending on the type of calculation automatically display scale setting may not be satisfactory In such a case use the manual setting procedure Manual setting...

Page 174: ...ease value End 1 Setting the number of moved point 1 Move the cursor to the position of the number of moved point setting MOV or SLI 2 Make the setting with the function keys or the JOG SHUTTLE contro...

Page 175: ...displays after data corresponding to recording length have been stored in memory When the STOP key is pressed twice during measurement the 8855 is forcibly stopped Waveform calculation are not execut...

Page 176: ...A and B cursors When there is no A and B cursors calculates all data For details on setting refer to Quick Start Section 8 2 Press the STATUS key to display the wave calculation screen Move the flash...

Page 177: ...157 1 2 3 4 5 6 7 8 9 10 11 12 13 14 15 Chapter 8 Search Function...

Page 178: ...cedure Screen Waveform display 1 Press the F7 SEARCH key on the Waveform display screen The position is displayed at lower of the screen 2 Press the F6 VIEW key 3 Use the function keys to move the mar...

Page 179: ...e Waveform display screen 2 The position is displayed 3 Using the function key to select Block Display 4 When the number of divisions is 31 or over change the bar graph using the up and down cursor ke...

Page 180: ...This is set in the trigger screen See Quick Start Chapter 7 for details about trigger settings Procedure Screen Waveform display TRIGGER 1 Sets triggering conditions See Quick Start Chapter 7 for det...

Page 181: ...gger search screen press the ESC key The Previous condition search of captured waveforms from the current position runs backward in time Therefore because a search from the current position using Next...

Page 182: ...m values Procedure Screen Waveform display TRIGGER 1 Press the F7 SEARCH key on the Waveform display screen 2 Press the F8 PEAK key on the function key display 3 Specify the channel where to search fo...

Page 183: ...e to enter more than 1000 event marks After measurement is completed event marks are displayed at the top of the Waveform screen Further event marks are printed in charts when Real Time Printing is en...

Page 184: ...s You can search using the elapsed time since triggering or the date Procedure Screen Waveform display 1 Press the F7 SEARCH key on the Waveform display screen 2 Press the F10 EVENT key on the functio...

Page 185: ...ts Procedure Screen Waveform display 1 Display the A and B cursors other than horizontal cursors on the display screen 2 Press the F7 SEARCH key on the function key display 3 The data is searched for...

Page 186: ...166 8 6 Moving Cursors to the Search Points...

Page 187: ...top recording on GO or NG result Pressing the START key starts measurement Data acquisition starts when the trigger conditions are met When the input waveform meets the stop conditions signals are out...

Page 188: ...sists of two actions namely capturing data and performing the evaluation These two actions are carried out in sequence not simultaneously Therefore data are not captured while the evaluation is in pro...

Page 189: ...if any part of waveform leaves evaluation area GO Stop on GO result NG Stop on NG result ALL OUT Return NG if entire waveform leaves evaluation area GO NG Stop on GO or NG result Waveform evaluation m...

Page 190: ...the Waveform display screen appear and then press the START key to initiate measurement For details on load see Quick Start Section 10 8 2 Creating a new evaluation area Procedure Screen STATUS 1 Pre...

Page 191: ...result Stop recording on GO or NG result 9 3 Setting the Waveform Evaluation Mode 9 4 Setting the GO NG Stop Mode Procedure Screen STATUS 1 Move the flashing cursor to Comparison 2 Make the setting wi...

Page 192: ...ea 1 Press this key 2 Use the cursor keys to move the paintbrush mark to the area to be filled in Pressing speed up accelerates the movement of the mark If the area is not completely enclosed adjacent...

Page 193: ...o terminate the line mode erase Serves to erase unwanted sections 1 Press this key 2 Use the cursor keys to move the eraser mark to the start point of the section to be erased Pressing speed up accele...

Page 194: ...area to be erased 5 Press the F4 SET key again The rectangular area is cleared Press the F5 CANCEL key Cancel the immediately preceding set point 6 Press the F6 exit key to terminate the clear area mo...

Page 195: ...rint Screen hard copy List print Report print NOTE Chapter 10 Printout of Measurement Data Printing is possible when the 8994 PRINTER UNIT is installed Waveform data can be printed out in two formats...

Page 196: ...r functions X Y quad X Y waveforms of graphs 1 to 4 are displayed and recorded in four screen memory and recorder functions Settings on the CHANNEL screen Settings on the STATUS screen Press the STATU...

Page 197: ...ens can be printed out as is List print The settings for the various functions made with the Status screen Channel screen etc can be printed out in list format Report print This function prints the wa...

Page 198: ...graphs 1 to 4 are displayed in one screen X Y waveforms of graphs 1 to 4 are displayed in four screen 10 2 Setting the STATUS Screen printout The style can be set for showing input signals on the scre...

Page 199: ...mber NOTE Set which graph type to use when display format has been set to DUAL QUAD or OCT screen display on the Status screen Procedure Screen ONE CH LIST CHANNEL 1 Press the CHAN key to display the...

Page 200: ...ress the CHAN key to display the Various channels ONE CH or List screen 2 Move the flashing cursor to the Wave_Disp position 3 Use the function keys to select density If the system is reset print dens...

Page 201: ...CHANNEL Screen printout 10 3 3 COMMENT Screen NOTE Three types of comment are available If COMMENT or SET COM is selected this comment will be included on the recording paper in all functions For det...

Page 202: ...182 10 4 Setting the SYSTEM Screen printout 10 4 Setting the SYSTEM Screen printout The various printer settings can be made on the system s Printer screen For details see Quick Start section 9 4...

Page 203: ...OFF CH3 COMMENT 500 s 1 ms 1 5 ms 3 V CH3 4 2 3 8 7 6 5 1 9 10 10 5 Example of Printer Output This section explains the printer type and how to read the printout in the case of a SINGLE format wavefor...

Page 204: ...2 Zero position comment ON 3 Counter print DATE 4 Title COMMENT 5 Logic COMMENT 6 Channel marker COMMENT The gauge upper and lower limits and zero position comments are printed out in this order Sinc...

Page 205: ...185 10 5 Example of Printer Output Printing the List MEM Example...

Page 206: ...red they can be printed as often as desired When magnification compression was used the printout reflects this condition If you want to stop the printing press the STOP key When A B cursor is ON it pr...

Page 207: ...er screen 2 Move the flashing cursor to the Auto Print item 3 Use the function keys to make a setting 3 4 Press the START key to start the measurement Printout is carried out automatically after a wav...

Page 208: ...4 When measurement starts waveform appears on screen and printout starts At a time axis range setting of 200 ms DIV or faster the waveform data will be printed out later See Quick Start Section 12 3 W...

Page 209: ...ons magnification x 1 of data in memory is printed Procedure Screen Waveform display 1 Press the DISP key to display the Waveform display screen 2 Position cursor A at the start point of the range to...

Page 210: ...ure Screen Excluding Waveform display Press the PRINT key on the screen excluding Waveform display The list to be printed contains the setup conditions for the acquired waveforms Even if the settings...

Page 211: ...s the files in this instrument For details on how to use the 9333 LAN COMMUNICATOR see the 9333 User s Guide and for details on communication commands see the explanation in the supplied FDD This sect...

Page 212: ...Port Number __x Default 880x Specify the first 3 digits of the number The last digit ranges from 0 to 9 reserving the ports for use by the unit Specifications in case 880x is unavailable You may ask y...

Page 213: ...e same network as the device Host Name This name represents the device on the network Do not duplicate the host name of other devices If acquisition of DNS or Gateway information is applicable it is a...

Page 214: ...peer or when connected to the same hub therefore turn this setting OFF When DNS is effective and the set IP address is other than 0 0 0 0 the set IP address is used If the IP address is set to 0 0 0 0...

Page 215: ...ress is used If the IP address is set to 0 0 0 0 DNS is used to search for the IP address For example names are set in the following format collect hioki co jp In the case of this example if hioki co...

Page 216: ...a 9642 LAN CABLE and connect it as illustrated below A cross cable is necessary when connecting this device and the PC one to one peer to peer A standard 10BASE T compatible cross cable or a straight...

Page 217: ...om external sources files can only be loaded Read and write enabled From external sources files can be read or written to or deleted Relationship Between the Various Media and Directories Each media c...

Page 218: ...measurement returns 211 START and when stopped returns 211 STOP Further you require an FTP client that can send recognized commands directly to the server when using SITE commands For example when us...

Page 219: ...ected in this manner its IP address while the instrument is receiving data is 192168 55 2 and the IP address of the sender is 192 168 55 1 When data is being sent the IP address for the instrument dif...

Page 220: ...NS If you want the IP address to be automatically acquired upon connection set Automatic Acquisition as the Priority Setting Dial A B data collection server Specifies the PC on which the 9333 data col...

Page 221: ...Host Name Specifies the server using a host name DNS is required When IP Address is selected an IP address is set in the next column below When Host Name is selected a host name is set in the next col...

Page 222: ...PC card is inserted it is automatically recognized and you can make the necessary settings RS 232C Transfer rate 1200 2400 4800 9600 19200 38400 57600 115200 Data length 8 or 7 bits Parity None even o...

Page 223: ...ably a double density floppy disk WARNING 012 Write Protected The media is write protected Release the write protect Appendix Appendix 1 Error Messages The instrument produces two levels of message to...

Page 224: ...s range has been changed There are restrictions for pairing the memory and recorder time axes when using REC MEM WARNING 049 The memory time axis range has been changed There are restrictions for pair...

Page 225: ...nection failed Check connection and settings WARNING 088 PPP Bad Telephon number Check the phone number WARNING 089 PPP Connection was aborted Connection aborted WARNING 090 LAN Bad MAC address Set or...

Page 226: ...High and Low level Logical formatting Formatting that writes basic file structure information to the physically formatted disks making them compatible for use with the 8855 system Low pass filter Fil...

Page 227: ...data in the internal memory Thermal head Print head of thermal printer Threshold value When turning an analog signal into a logic signal the level at which the measured value is divided between High...

Page 228: ...urements is termed the sampling rate The units are S s read as samples per second This is the reciprocal of the sampling period 1 T If the frequency of the signal being measured is significantly highe...

Page 229: ...IV 2 min DIV 5 min DIV 50 ns 100 ns 200 ns 500 ns 1 s 2 s 5 s 10 s 20 s 50 s 100 s 200 s 500 s 1 ms 2 ms 5 ms 10 ms 20 ms 50 ms 100 ms 300 ms 600 ms 1 2 s 3 s 800 kHz 400 kHz 200 kHz 80 kHz 40 kHz 20...

Page 230: ...ling period One division is equal to 100 samples One piece of sample data collected using the recorder function contains the maximum and minimum voltage obtained in the set sampling period Therefore t...

Page 231: ...nction An N 1 An 1 Zn N N Specified averaging count n Averaging count An Result of n times averaging Zn n th measurement data Y SCH SCL VH VL x VH x SCL VL x SCH VH VL VH Voltage high point SCH Scalin...

Page 232: ...value of the waveform 5 Time to maximum value Calculates the time interval from the triggering point to the maximum value of the waveform in seconds If there are two maximum value points the time to t...

Page 233: ...trace are used the first rising slope or falling slope within the range defined by the cursors is used It is possible to set values of the rise time 10 to 90 and of the fall time to 90 to 10 12 Standa...

Page 234: ...be used to specify the range see Quick Start Section 8 2 for X Y plotting and area calculation On the X Y screen of the memory function it is not possible to specify the range with the A B cursors 15...

Page 235: ...intersection of the next opposite slope Tu d Time from rise to fall s Td u Time from fall to rise s 18 Pulse Count Counts the pulse s number of intersections of the set level by the rising or falling...

Page 236: ...xp di i 1 2 n 4 Common logarithm LOG When di 0 bi log10di When di 0 bi overflow value is output When di 0 bi log10 di i 1 2 n Use the following equation to convert to natural logarithm LnX logeX log10...

Page 237: ...8dn 3 8dn 1 dn 12h Point tn 1 bn 1 dn 4 6dn 3 18dn 2 10dn 1 3dn 12h Point tn bn 3dn 4 16dn 3 36dn 2 48dn 1 25dn 12h b1 to bn data of calculation result h t sampling period 2st differential Point t1 b...

Page 238: ...processing result data 12 Sine SIN bi sin di i 1 2 n 13 Cosine COS bi cos di i 1 2 n 14 Tangent TAN bi tan di i 1 2 n 10 bi 10 15 Arc sine ASIN bi 2 di 1 bi asin di 1 di 1 bi 2 di 1 16 Arc cosine ACO...

Page 239: ...ency components which combine to create the final shape of the waveform Expressing waveform the source signal as a function of its frequency components yields a frequency domain representation Often t...

Page 240: ...it impulse response h t can be obtained by performing an FFT operation and an inverse FFT operation Aliasing When the frequency of the signal to be measured approaches the sampling frequency beyond a...

Page 241: ...filter In FFT processing when the frequency bandwidth of the input signal is unlimited frequency spectrum components that do not exist will appear due to aliasing To prevent this a low pass filter is...

Page 242: ...nti aliasing filter is present fine square waves are monitored through the high frequency amplifier so the corners of square waves include high frequency components The aliasing artifacts are removed...

Page 243: ...This is called window processing The FFT algorithm assumes that the data of that limited segment are repeated and defines the input signal using a periodic function for determining the frequency spect...

Page 244: ...e window function To minimize the leakage error a suitable window should be chosen which matches the type of input signal Possible window types include rectangular Hanning exponential flat top minimum...

Page 245: ...Waveform assumed by FFT processing Input waveform Hanning window Waveform after window processing Waveform assumed by FFT processing Input waveform Exponential window Waveform after window processing...

Page 246: ...nverted files may be read by a spreadsheet program System requirements For a PC running Windows 95 98 Me Windows NT4 0 SP3 or later Windows 2000 or Windows XP Installation Install the viewer by follow...

Page 247: ...e left these are Open Save All Save Between Cursors Batch Conversion Properties Wave Control Panel Trace Zoom Out Zoom In and Exit For details of these operations see the descriptions of the correspon...

Page 248: ...to Appendix 4 4 Refer to Appendix 4 5 Refer to Appendix 4 1 Refer to Appendix 4 1 Refer to Appendix 4 1 Refer to Appendix 4 3 Refer to Appendix 4 3 Refer to Appendix 4 3 Refer to Appendix 4 3 Refer to...

Page 249: ...Time Notation Grid Type Title Remarks Fixed Color Font Capture Right click with the mouse Trig A cursor B cursor DIV Sec Point Trig Date None Standard Fine Text Background Grid Refer to Appendix 4 3 R...

Page 250: ...le menu select Open to display the file selection dialog box Select a waveform file and click Open to read in the file and display the waveform Changing the time axis scale zoom function You can chang...

Page 251: ...ition Waveform Control Panel You can adjust the display for each channel separately In the View menu select Wave Control Panel to display a dialog box Checking the waveform measurement conditions Prop...

Page 252: ...form screen Fixing waveform view conditions Select View then Fixed on the menu to always view waveforms with the same color display position and magnification When this item is enabled the file view s...

Page 253: ...he range Then to save all of the data in the File menu select Save All to save the range only in the File menu select Save Between Cursors A dialog box appears for setting the file to be saved and the...

Page 254: ...ember that not all data needs to be converted This setting is useful when you need data over a broad time span 4 In the Output Folder specify the folder in which to save the CSV files converted from w...

Page 255: ...14 720 20000 4 006 912 8 008 192 12 008 960 20 010 496 36 013 568 50000 10 007 040 20 008 448 30 009 344 50 011 136 90 014 720 100000 20 006 912 40 008 192 60 008 960 100 010 496 180 013 568 200000 40...

Page 256: ...20 8 012 800 12 013 568 20 015 104 36 018 176 20000 8 011 776 16 013 312 24 014 336 40 016 384 72 020 480 50000 20 011 520 40 012 800 60 013 568 100 015 104 180 018 176 100000 40 011 776 80 013 312 12...

Page 257: ...25 565 575 649 875 817 100 550 481 700 523 850 565 1 150 649 1 750 817 200 1 100 481 1 400 523 1 700 565 2 300 649 3 500 817 500 2 750 481 3 500 523 4 250 565 5 750 649 8 750 817 1000 5 500 481 7 000...

Page 258: ...45 1 655 973 100 910 517 1 210 574 1 510 631 2 110 745 3 310 973 200 1 820 517 2 420 574 3 020 631 4 220 745 6 620 973 500 4 550 517 6 050 574 7 550 631 10 550 745 16 550 973 1000 9 100 517 12 100 574...

Page 259: ...141 APPENDIX10 Averaging 60 APPENDIX9 B Bar graph 158 Binary format 46 73 Block display 159 Burn out 122 C COPY key 190 Calculation function 137 Channel marker 184 Channel mode 53 Character entry 109...

Page 260: ...NDIX10 Frequency measurement 124 Frequency range 54 Function mode 35 53 Functional grounding terminal 12 Fuse 11 G GO NG 143 167 GP IB 202 Gateway 194 Grounding iv viii 6 11 13 20 30 H Handle ix 7 Han...

Page 261: ...X13 Pulse duty ratio 128 Pulse width 129 141 APPENDIX12 R RMS measurement 118 RMS spectrum 80 RMS value 141 APPENDIX10 RS 232C 202 Rated supply frequency 11 13 Rated supply voltage 11 13 Real time pri...

Page 262: ...e 62 136 Trigger search 160 U Unbalanced input APPENDIX5 Unit impulse response 90 Upper lower print 184 User name 197 V Variable function 99 Variable recording length 37 Vernier function 113 View func...

Page 263: ......

Page 264: ......

Reviews: