GE
D
IRECTION
FQ091019, R
EVISION
2
V
IVID Q
N S
ERVICE
M
ANUAL
Chapter 7 - Diagnostics/Troubleshooting
7-9
NOTE:
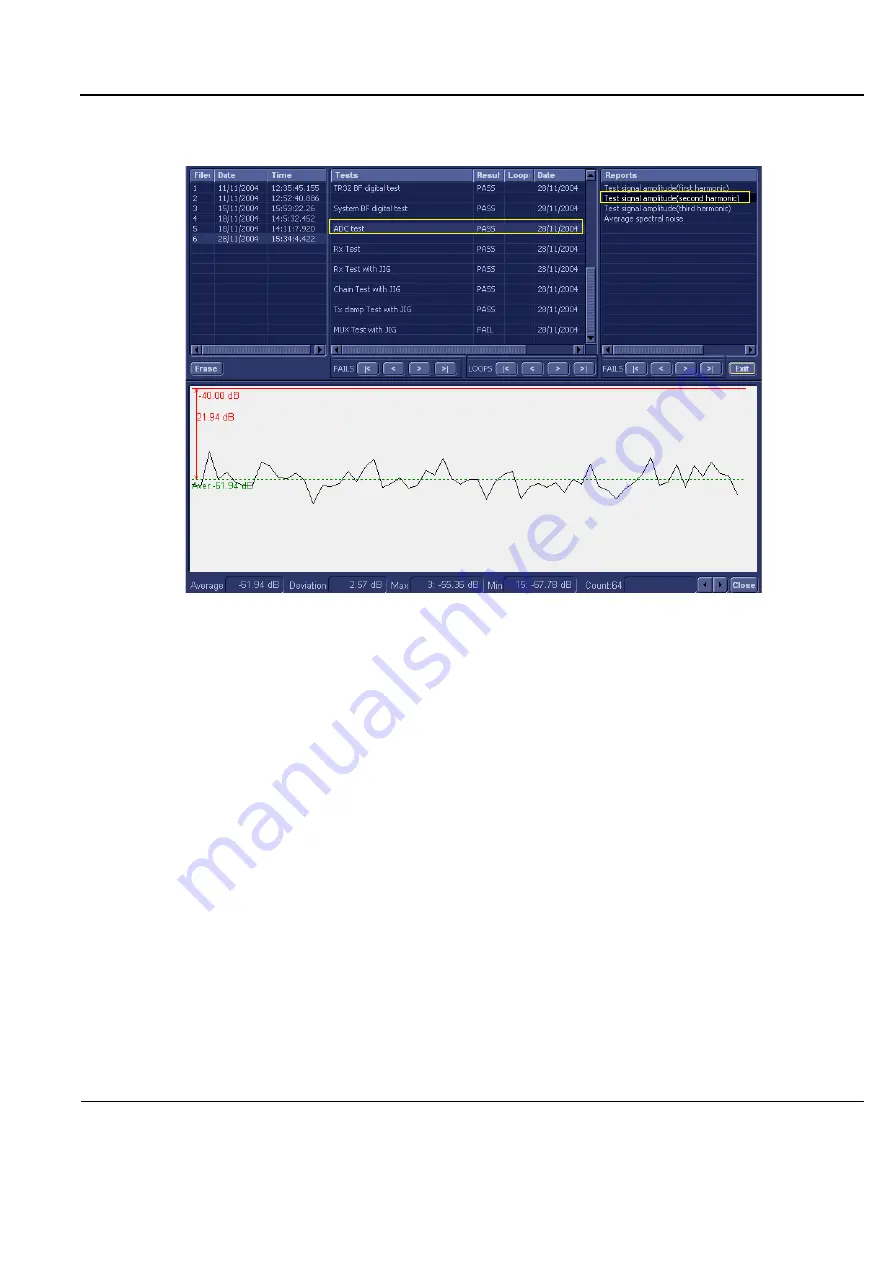
Left and right arrows provided in the View Report window enable scrolling between the different
channels.
Left-clicking on a currently-selected channel marks a red square on the report graph, and also
evokes the display of the following information relative to that specific point: Average, Deviation
(standard deviation from the Average), Max, and Min.
The signal should be within the limits marked in the white area (the dotted line represents the
Average), as shown in
.
Figure 7-4 ADC Test - Viewing Report (Test Signal Amplitude 2nd Harmonic)


