


230
measurements are not included.
In addition, you can send the latest trend data from the Trendline software to the
Detector (see Communication settings
). The number is limited to a maximum
of 10 values. These values are considered in the trend display ever! If you use for
example 10 values from the Trendline, there are remaining at most 9 values for
previous measurements and 1 for the current measurement.
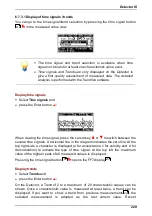
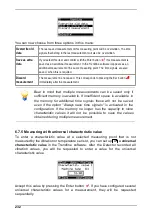
In the trend view you can use the cursor key
or
to switch between the
several trends. A horizontal line in the diagram indicates the main alarm limit. A
horizontal broken line indicates the pre-alarm limit. In the middle of the window
number and type of the characteristic value are displayed. Individual
measurement points ( ) are joined by lines.
Pressing the time signal button
opens a table with measured values that
are used for the trend view. Table values are sorted in descending order by date,
time and measured value.
Press the Enter button
or the Esc button
, to change to the trend view.
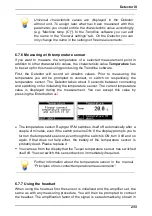
If you canceled measuring of temperature or the "universal"
characteristic value, only the existing values are shown in the trend.
The missing value is shown b y three dashes in the tab le of
measured values.
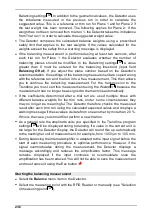
6.7.3.2 FFT display
You can go to the FFT display by pressing the time signal button
in the time
signal view.
151
212
212