


130
Click on
Show trends
to create a trend graph that of the measured values for
the period specified.
Click on
Selected
to display only a selection of available characteristic values
and select the required characteristic values from the list.
You can use the
Show table of results
option to instruct Trendline to create a
table containing the measured values.
Select time signal / FFT
In the
Time signal / FFT
area you can specify which time signals are displayed
and also whether their corresponding frequencies should be included in the
report.
Click on
Time signal
or
FFT
to activate the corresponding display.
Click on
Selected
to display only a selection of available signals and select the
required signals from the list.
Click on
Last time signal / FFT only
to display only the last signals saved in
each case. All previous measurements will be ignored.
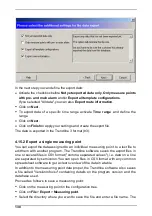
Display additional information
The following options can be selected under
Additional info
: